- Education
- Forex Technical Analysis
- Technical Indicators
- Trend Indicators
- Supertrend Indicator
Supertrend Indicator: Definition, Formula and How to Use
Forex trading involves the buying and selling of different currencies in the global market. Traders strive to make profitable trades by predicting the movement of currency pairs. To make informed decisions, traders rely on various tools and indicators, one of which is the Supertrend Indicator.
In this article, we will explore what the Supertrend Indicator is, how to use it effectively, and the formula and calculation behind it.

What is Supertrend Indicator
The Supertrend Indicator is a popular technical analysis tool used by traders to identify the direction of a trend and potential entry or exit points. It is a trend-following indicator that helps traders determine whether to go long (buy) or short (sell) in a given market.
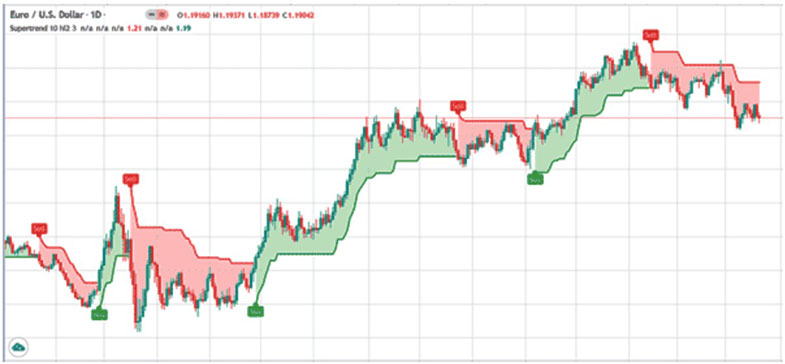
The Supertrend Indicator plots a line on the price chart that indicates the current trend direction. When the line is below the price, it suggests a bullish (upward) trend, indicating that it may be a good time to buy.
Conversely, when the line is above the price, it suggests a bearish (downward) trend, indicating that it may be a good time to sell.
How to use Supertrend Indicator
Below are some ways to use the Supertrend indicator:
1. Recognize Trends
The Supertrend indicator helps identify the prevailing market trends, whether it's an uptrend, downtrend, or a sideways trend.
2. Identify Trading Signals
By observing the Supertrend indicator, traders can spot potential trading signals. For instance, if the Supertrend indicator is in an uptrend and the price breaks above the indicator line, it may indicate a buy signal.
3. Validate Trading Signals
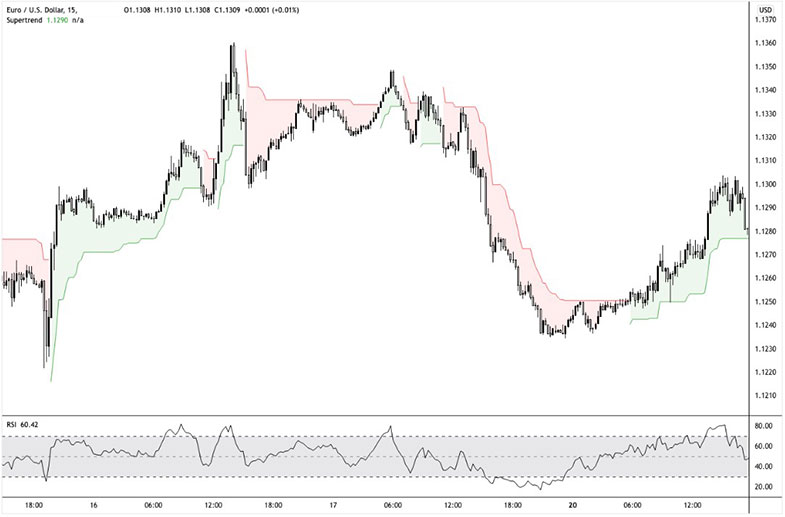
The Supertrend indicator can be employed to confirm signals generated by other technical analysis tools. For instance, if the relative strength index is signaling overbought conditions and the Supertrend indicator confirms an uptrend, it may suggest an impending market reversal.
Consider the following tips when using the Supertrend indicator:
1. Optimize Parameters
The Supertrend indicator requires selecting appropriate parameters, such as the moving average period and the multiplier. The moving average period determines the number of bars considered in calculating the trend line, while the multiplier establishes the distance between the trend line and the bands.
2. Factor in Other Elements
While the Supertrend indicator is valuable, it should not be the sole basis for trading decisions. Traders should also consider other factors, such as economic news, political events, and interest rates, which can impact market movements.
3. Combine with Other Tools
To gain a comprehensive perspective, it is recommended to use the Supertrend indicator in conjunction with other technical analysis tools like moving averages, Bollinger bands, and the relative strength index (RSI).
How to utilize the Supertrend indicator:
1. Identifying Trends
The Supertrend indicator assists in recognizing the current market trends, including uptrends, downtrends, or sideways movement. For instance, when the Supertrend indicator is in an uptrend and the price breaks above the Supertrend line, it could indicate a potential buying opportunity.

Spotting Trading Signals
The Supertrend indicator can identify trading signals that warrant attention. For example, if the Supertrend indicator indicates an uptrend and the price breaks below the Supertrend line, it may signal a potential selling opportunity.
Confirming Signals
The Supertrend indicator can serve as a confirmation tool for signals generated by other technical analysis indicators. For instance, if the RSI indicates overbought conditions and the Supertrend indicator confirms an ongoing uptrend, it may suggest an impending market reversal.

It's important to note that these applications and tips serve as general guidelines, and traders should adapt them to their specific trading strategies, preferences, and market conditions.
Supertrend Indicator Formula
The Supertrend Indicator formula involves a combination of the average true range (ATR) and a multiplier. The average true range measures market volatility, while the multiplier adjusts the sensitivity of the indicator.
The formula is as follows:
Upperband = (High + Low) / 2 + Multiplier * ATR Lowerband = (High + Low) / 2 - Multiplier * ATR
Where:
- High is the highest price of the current period
- Low is the lowest price of the current period
- ATR is the average true range
- Multiplier is a user-defined value that determines the sensitivity of the indicator

Supertrend Indicator Calculation
To calculate the Supertrend Indicator, follow these steps:
- Set the initial upper and lower bands to zero.
- Calculate the average true range (ATR) using the desired period. ATR measures market volatility and is often calculated as a 14-day period.
- Calculate the upper band using the formula mentioned earlier.
- Calculate the lower band using the formula mentioned earlier.
- If the current closing price is higher than the previous upper band, update the upper band to the new value. Otherwise, keep it unchanged.
- If the current closing price is lower than the previous lower band, update the lower band to the new value. Otherwise, keep it unchanged.
- Plot the upper and lower bands on the price chart, with the upper band above the price during a bullish trend and the lower band below the price during a bearish trend.
Supertrend Indicator Settings
The Supertrend Indicator is a versatile tool that can be customized based on individual trading preferences and market conditions. While there are no fixed settings that guarantee success, here are some common settings and parameters that traders often consider when using the Supertrend Indicator:
- Period: The period refers to the number of bars or candles used to calculate the indicator's values. A longer period, such as 14 or 20, provides a broader view of the trend, while a shorter period, like 7 or 10, captures more immediate price movements. Traders may adjust this parameter based on their trading style and the timeframe they are using.
- Multiplier: The multiplier is a value that determines the sensitivity of the Supertrend Indicator. It influences the distance between the indicator line and the price. A higher multiplier value makes the indicator more sensitive to price changes, resulting in more frequent trend changes. Conversely, a lower multiplier value provides a smoother indicator line with fewer fluctuations. Traders often experiment with different multiplier values based on market volatility and personal preferences.
- Source: The source refers to the price data used to calculate the Supertrend Indicator. The most common options are the closing price or the average price (average of high, low, and close). The closing price is widely used as it reflects the final market sentiment at the end of each period. However, some traders prefer using the average price for a more balanced representation of market dynamics.
- ATR Period: The Average True Range (ATR) is an essential component of the Supertrend Indicator. It measures market volatility and helps determine the size of the indicator's bands. The ATR period determines the number of bars or candles used to calculate the ATR. A longer ATR period captures a more extended range of price movements, while a shorter period focuses on recent volatility. Traders may adjust this parameter based on their trading style and the market conditions they are trading in.
- ATR Multiplier: The ATR multiplier is a value that determines the width of the Supertrend Indicator bands. It is multiplied by the ATR to calculate the upper and lower bands of the indicator. A higher multiplier results in wider bands, allowing for more significant price fluctuations before a trend reversal is signaled. Conversely, a lower multiplier narrows the bands and provides more conservative signals. Traders often adjust this parameter based on their risk tolerance and the desired balance between accuracy and sensitivity.
It's important to note that these settings and parameters are not fixed rules and may vary based on individual trading strategies, preferences, and market conditions. We encourage traders to experiment with different settings, backtest their strategies, and refine their approach based on their own analysis and experience.
Bottom Line on Supertrend Indicator
The Supertrend Indicator is a valuable tool for Forex traders, providing insights into the direction of trends and potential entry or exit points. By incorporating this tool into your trading strategy and understanding its calculations, you can enhance your ability to make informed trading decisions.
However, it's important to note that the Supertrend Indicator, like any other technical analysis tool, is not foolproof. It should be used in conjunction with other indicators and analysis methods to confirm trade setups and avoid relying solely on a single indicator.
As with any trading tool, it is recommended to practice using the Supertrend Indicator in a demo account or with small positions before applying it to live trading. This allows traders to familiarize themselves with its features and develop a strategy that suits their individual trading style.
In conclusion, the Supertrend Indicator offers a valuable perspective on market trends and potential trading opportunities. By mastering the usage of this indicator and combining it with other analysis techniques, you can enhance your Forex trading skills and increase your chances of success.
Forex Indicators FAQ
What is a Forex Indicator?
Forex technical analysis indicators are regularly used by traders to predict price movements in the Foreign Exchange market and thus increase the likelihood of making money in the Forex market. Forex indicators actually take into account the price and volume of a particular trading instrument for further market forecasting.
What are the Best Technical Indicators?
Technical analysis, which is often included in various trading strategies, cannot be considered separately from technical indicators. Some indicators are rarely used, while others are almost irreplaceable for many traders. We highlighted 5 the most popular technical analysis indicators: Moving average (MA), Exponential moving average (EMA), Stochastic oscillator, Bollinger bands, Moving average convergence divergence (MACD).
How to Use Technical Indicators?
Trading strategies usually require multiple technical analysis indicators to increase forecast accuracy. Lagging technical indicators show past trends, while leading indicators predict upcoming moves. When selecting trading indicators, also consider different types of charting tools, such as volume, momentum, volatility and trend indicators.
Do Indicators Work in Forex?
There are 2 types of indicators: lagging and leading. Lagging indicators base on past movements and market reversals, and are more effective when markets are trending strongly. Leading indicators try to predict the price moves and reversals in the future, they are used commonly in range trading, and since they produce many false signals, they are not suitable for trend trading.

Not sure about your Forex skills level?
Take a Test and We Will Help You With The Rest
You can see the graphical object on the price chart by downloading one of the trading terminals offered by IFC Markets.

Was this article helpful?
 You can study CFD trading more thoroughly and see CFD trading examples in the section How To Trade CFDs Visit Educational Center
