- Analýza
- Technická analýza
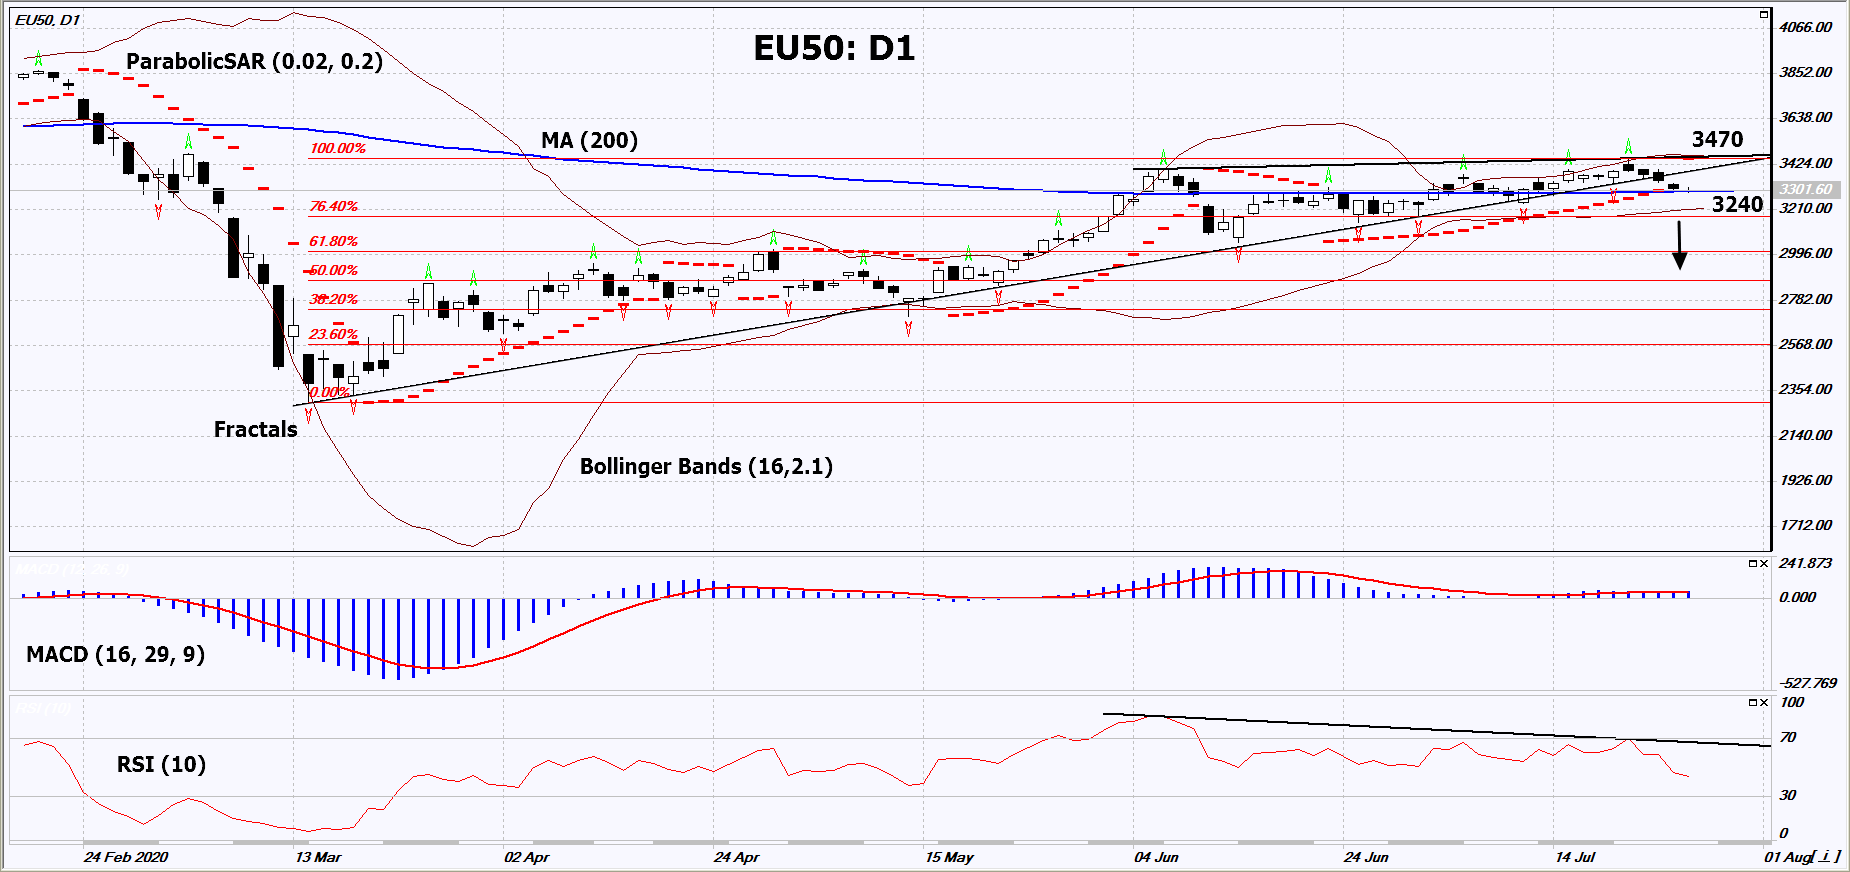
EU 50 Index Technická analýza - EU 50 Index Obchodování: 2020-07-28
Euro Stocks 50 Index Technical Analysis Summary
níže 3240
Sell Stop
výše 3470
Stop Loss
| Indicator | Signal |
| RSI | Sell |
| MACD | Neutrální |
| MA(200) | Neutrální |
| Fractals | Sell |
| Parabolic SAR | Sell |
| Bollinger Bands | Neutrální |
Euro Stocks 50 Index Chart Analysis
Euro Stocks 50 Index Technická analýza
On the daily timeframe, EU50: D1 broke down the uptrend support line and is trying to correct downwards. A number of technical analysis indicators formed signals for а further decline. We do not rule out a bearish movement if EU50 falls below the last two lower fractals and the 200-day moving average line: 3240. This level can be used as an entry point. We can set a stop loss above the upper Bollinger line, the last upper fractal and the Parabolic signal: 3470. After opening a pending order, we should move the stop loss following the Bollinger and Parabolic signals to the next fractal low. Thus, we change the potential profit/loss ratio in our favor. The most risk-averse traders, after the transaction, can switch to a four-hour chart and set a stop-loss, moving it in the direction of the trend. If the price meets the stop loss (3470) without activating the order (3240), it is recommended to delete the order: the market sustains internal changes not taken into account.
Fundamentální analýza Indexy - Euro Stocks 50 Index
The financial performance of European companies is expected to deteriorate at the end of the second quarter. Will the EU50 index quotations drop?
Refinitiv analytical agency predicts a reduction in the total profit of European companies from the STOXX 600 index list by 58.6%, and earnings - by 18.3%. Q2 2020 and Q2 2019 are compared. The Energy, Consumer Cyclicals, Industrials, Basic Materials and Financials sectors may become the top losers. There is no separate estimate of the EU50 index, but it is likely that its total revenues and profits will also decline. Recall that now the EU50 is traded 12.5% below its level at the beginning of 2020 and 6.5% lower than a year ago. It rose by 43.5% from its minimum in mid-March this year. Macroeconomic data able to affect the dynamics of the EU50 will be published on Thursday and Friday (July 30-31): GDP, unemployment, inflation and retail sales in Germany, inflation and GDP in the Eurozone, as well as a number of other indicators.
Poznámka:
Tento přehled má informativně poznávací charakter a publikuje se zdarma. Všechny údaje, uvedené v přehledu, jsou získány z otevřených zdrojů, jsou uznávány více méně spolehlivé. Přitom, neexistují žádné garance, že uvedená informace je úplná a přesná. Přehledy se v budoucnu neobnovují. Veškerá informace v každém přehledu, včetně názorů, ukazatelů, grafů, je pouze poskytována a není finančním poradenstvím nebo doporučením. Celý text nebo jeho jakákoliv část a také grafy nelze považovat za nabídku provádět nějaké transakce s jakýmikoliv aktivy. Společnost IFC Markets a její zaměstnanci za žádných okolností nemají žádnou odpovědnost za jakékoli kroky učiněné kýmkoliv po nebo v průběhu seznámení s přehledem.


