- Analytics
- Technical Analysis
Arabica Coffee Technical Analysis - Arabica Coffee Trading: 2019-04-09
Low coffee prices can cut the volume of production
A number of countries can reduce coffee production amid a decrease in its value to a 13-year high. Is there a possibility for Coffee prices to correct upward?
The Brazilian government, for the first time since 2013, is going to set fixed prices for the purchase of coffee from local farmers with the aim of supporting the agricultural sector. At the same time, according to state forecasts, the situation will be mostly rectified due to the actions of the farmers themselves. Amid the price decrease and drought, coffee production in Brazil in 2019 may be from 50.5 to 54.5 million 60-kg bags. This is noticeably less than the harvest of 2018 in the amount of 61.5 million bags. The Colombian government is going to send $50 million to support its farmers. According to the Colombian coffee growers’ federation, current coffee prices within the country are 9% lower than the cost of producers. Let us note that in 2018, Colombia has already reduced coffee production by 4.5% to 13.6 million 60-kg bags. The decline may continue in the current year. Let us note that now a large number of net short positions on coffee has been formed on the American stock exchange ICE Futures. Their closure may contribute to the upward, speculative movement of prices.
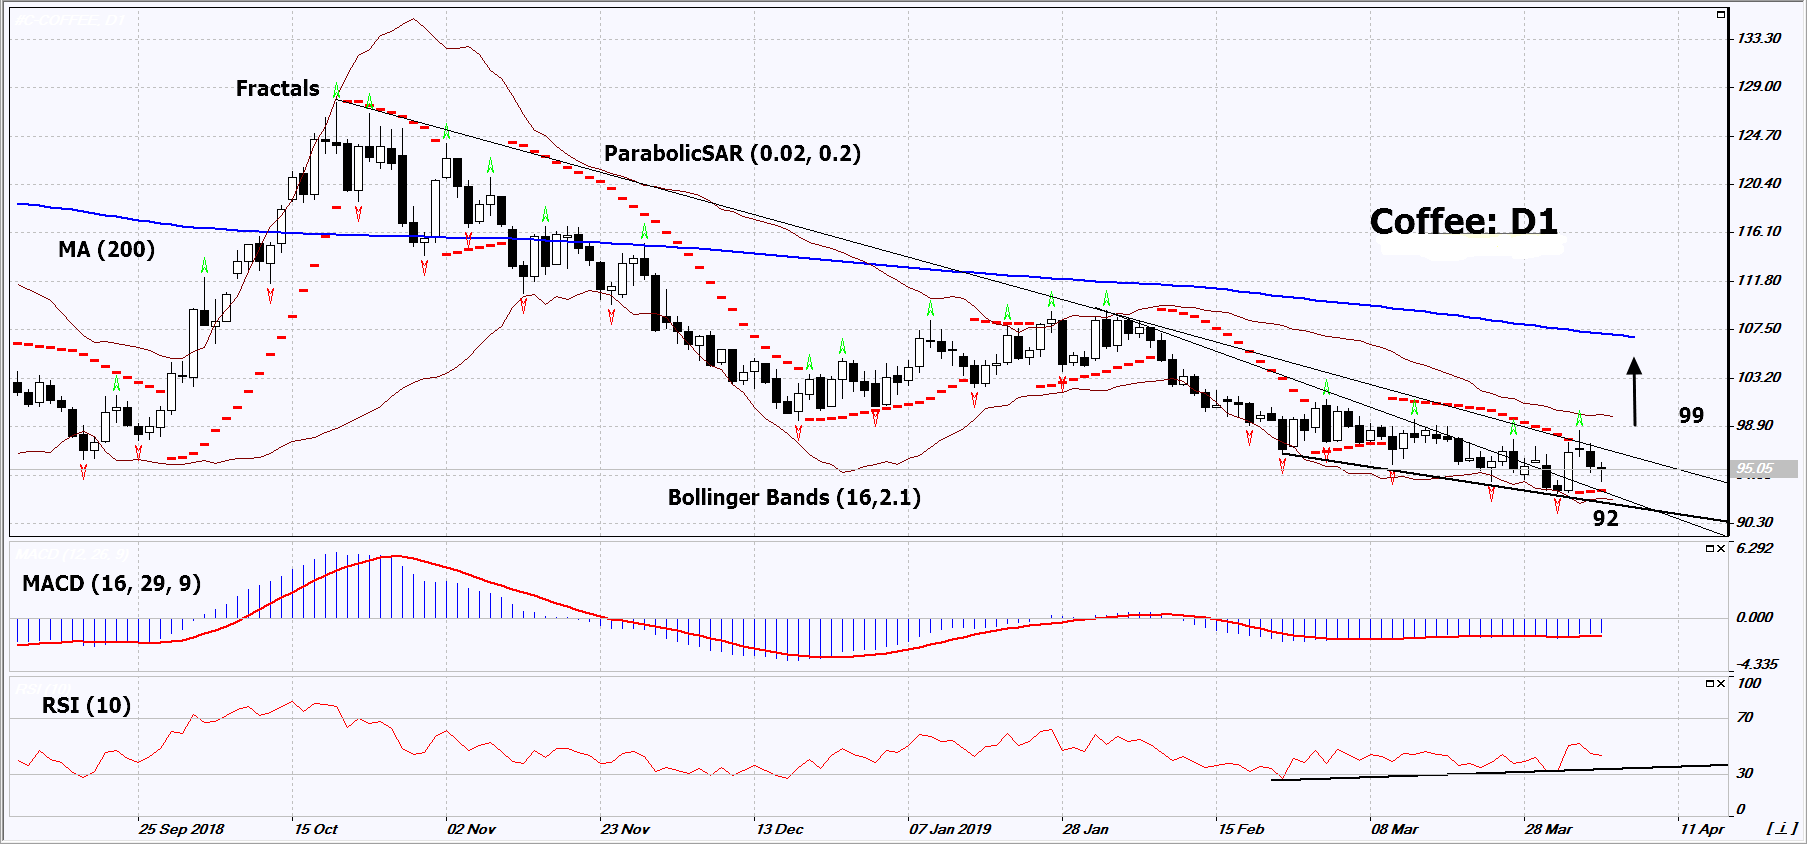
On the daily timeframe, Coffee: D1 approached the resistance line of the medium-term downtrend. Before opening a buy position, it should be breached up. A number of technical analysis indicators formed buy signals. The further price increase is possible in case of a reduction in production.
- The Parabolic Indicator gives a bullish signal.
- The Bollinger bands have narrowed, which indicates low volatility. Both Bollinger bands are titled upward.
- The RSI indicator is below 50. It has formed a positive divergence.
- The MACD indicator gives a bullish signal.
The bullish momentum may develop in case Coffee exceeds its two last fractal highs at 99. This level may serve as an entry point. The initial stop loss may be placed below the 13-year low, the lower Bollinger band and the Parabolic signal at 92. After opening the pending order, we shall move the stop to the next fractal low following the Bollinger and Parabolic signals. Thus, we are changing the potential profit/loss to the breakeven point. More risk-averse traders may switch to the 4-hour chart after the trade and place there a stop loss moving it in the direction of the trade. If the price meets the stop level (92) without reaching the order (99), we recommend to close the position: the market sustains internal changes that were not taken into account.
Summary of technical analysis
| Position | Buy |
| Buy stop | Above 99 |
| Stop loss | Below 92 |
- Get Certificate

Note:
This overview has an informative and tutorial character and is published for free. All the data, included in the overview, are received from public sources, recognized as more or less reliable. Moreover, there is no guarantee that the indicated information is full and precise. Overviews are not updated. The whole information in each overview, including opinion, indicators, charts and anything else, is provided only for familiarization purposes and is not financial advice or а recommendation. The whole text and its any part, as well as the charts cannot be considered as an offer to make a deal with any asset. IFC Markets and its employees under any circumstances are not liable for any action taken by someone else during or after reading the overview.
