- Analytics
- Technical Analysis
Dow Jones Index Technical Analysis - Dow Jones Index Trading: 2018-03-20
Several factors can contribute to stock market corrections at once
Stock prices of American industrial companies are falling amid the meeting of the heads of central banks and G-20 finance ministers (Group of Twenty). Investors are afraid of the criticism of Donald Trump’s new tariff policy. Will the Dow Jones stock index fall?The meeting of the G-20 will be held on March 19-20. Previously, Trump imposed a prohibitive import duties on steel and aluminum in the United States. Stocks of the US industrial companies are falling, as investors fear that the G-20 countries will not agree with the further tightening of the foreign trade by the US. Generally, an additional negative factor for the US stock market was the sharp decrease in Facebook stocks. Its prices collapsed after the report of illegal provision of information on 50 million users during the last presidential elections in the US in 2016. Against the background of this, the stocks of other FAANG companies fell as well: Amazon, Apple, Netflix and Alphabet. On Wednesday, March 21, the next Fed meeting will be held during which a rate hike is expected. This can increase the loan debt of US corporations.
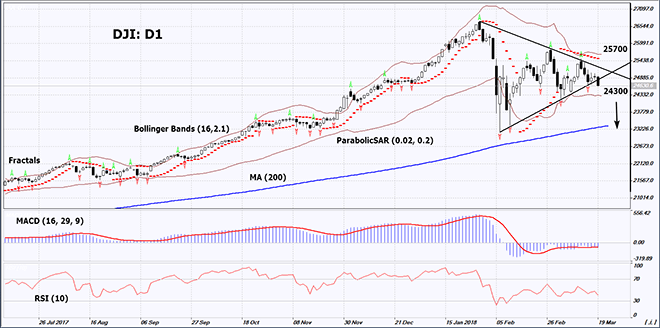
On the daily timeframe, DJI: D1 exited lower from the triangle. The further price decrease is possible in case of the publication of negative economic and political news in the United States.
- The Parabolic indicator gives a bearish signal.
- The Bollinger bands have narrowed, which indicates low volatility.
- The RSI indicator is below 50. No divergence.
- The MACD indicator gives a bearish signal.
The bearish momentum may develop in case DJI falls below its last fractal low and the lower Bollinger band at 24300. This level may serve as an entry point. The initial stop loss may be placed above the last fractal high, the Parabolic signal and the upper Bollinger band at 25700. After opening the pending order, we shall move the stop to the next fractal high following the Bollinger and Parabolic signals. Thus, we are changing the potential profit/loss to the breakeven point. More risk-averse traders may switch to the 4-hour chart after the trade and place there a stop loss moving it in the direction of the trade. If the price meets the stop level at 25700 without reaching the order at 24300, we recommend cancelling the position: the market sustains internal changes that were not taken into account.
Summary of technical analysis
| Position | Sell |
| Sell stop | Below 24300 |
| Stop loss | Above 25700 |
- Get Certificate

Note:
This overview has an informative and tutorial character and is published for free. All the data, included in the overview, are received from public sources, recognized as more or less reliable. Moreover, there is no guarantee that the indicated information is full and precise. Overviews are not updated. The whole information in each overview, including opinion, indicators, charts and anything else, is provided only for familiarization purposes and is not financial advice or а recommendation. The whole text and its any part, as well as the charts cannot be considered as an offer to make a deal with any asset. IFC Markets and its employees under any circumstances are not liable for any action taken by someone else during or after reading the overview.
