- Analytics
- Technical Analysis
Grain Commodities Technical Analysis - Grain Commodities Trading: 2018-01-09
Cold weather in the US may damage cereal crops
In this review, we suggest considering the personal composite instrument (PCI) "Grain Index". It reflects the price dynamics of the portfolio of 4 popular grain exchange commodities. Will the Grain_4 quotes increase?
The main reason for such a scenario may be the strong cooling in the US, which may reduce the production of cereal crops. However, it should be noted that the USDA will begin to make forecasts for the new crop closer to March of this year. Up to this point, a significant change in quotes may not happen. There are several additional factors for a possible growth of grain prices. According to the Buenos Aires Grains Exchange data, a part of the soybean crops with an area of 18.1 mln hectares may not be harvested in this agricultural season because of a drought in Argentina. The total cereal crop in Argentina may drop to 118-120 mln tonnes, compared with 130 mln tonnes in the previous season. Anomalously warm weather is observed in Russia. In many regions of the country there is no snow cover. A cold weather return may have an essentially negative impact on the sowings of winter wheat and other cereal crops.
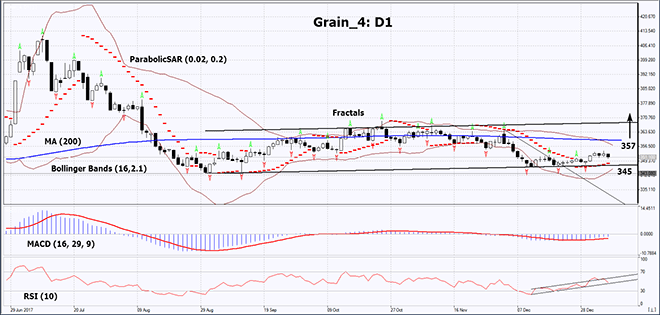
On the daily timeframe, Grain_4: D1 is in the neutral range. It did not manage to exceed its lower border and is moving towards its upper border. The further price increase is possible in case of continual bad weather conditions in the US and a crop decrease in other countries.
- The Parabolic indicator gives a bullish signal.
- The Bollinger bands have markedly narrowed, which means lower volatility.
- The RSI indicator is below 50. No divergence.
- The MACD indicator gives a bullish signal.
The bullish momentum may develop in case Grain_4 exceeds its last high and the upper Bollinger band at 357. This level may serve as an entry point. The initial stop loss may be placed below the Parabolic signal, the lower Bollinger band and the last three fractal lows at 345. After opening the pending order, we shall move the stop to the next fractal low following the Bollinger and Parabolic signals. Thus, we are changing the potential profit/loss to the breakeven point. More risk-averse traders may switch to the 4-hour chart after the trade and place there a stop loss moving it in the direction of the trade. If the price meets the stop level at 357 without reaching the order at 345, we recommend cancelling the position: the market sustains internal changes that were not taken into account.
Summary of technical analysis
| Position | Buy |
| Buy stop | above 357 |
| Stop loss | below 345 |
- Get Certificate

Note:
This overview has an informative and tutorial character and is published for free. All the data, included in the overview, are received from public sources, recognized as more or less reliable. Moreover, there is no guarantee that the indicated information is full and precise. Overviews are not updated. The whole information in each overview, including opinion, indicators, charts and anything else, is provided only for familiarization purposes and is not financial advice or а recommendation. The whole text and its any part, as well as the charts cannot be considered as an offer to make a deal with any asset. IFC Markets and its employees under any circumstances are not liable for any action taken by someone else during or after reading the overview.
