- Analytics
- Technical Analysis
NZD/USD Technical Analysis - NZD/USD Trading: 2017-10-18
Rise of inflation increases the likelihood of a rate hike
The rise of inflation in New Zealand in the 3rd quarter of 2017 exceeded forecasts. Will the prices of the New Zealand dollar grow?
The increase in the consumer price index was 1.9% year-over-year. This is more than the indicator of the 2nd quarter (+ 1.7%), and the forecast of the Reserve Bank of New Zealand (RBNZ) (+ 1.6%). In spite of the fact that inflation still remains in the target range of 2% plus-minus 1%, the probability of the RBNZ rate hike is increasing. Currently, it is at the historical minimum and is + 1.75%. This year, the last meeting of the RBNZ will be held on November 8. The possible rate hike contributes to the strengthening of the exchange rate. An additional positive factor for the New Zealand dollar may be the formation of the government according to the results of the parliamentary elections on September 23, 2017. None of the two leading political forces (the National and Workers' Parties) was able to obtain the absolute majority in the New Zealand Parliament, which is necessary to form the government of the country. Now they have created coalitions with smaller parties, which will allow forming the government and reduce political risks. The next significant economic information in New Zealand will be published on October 26, 2017 - the foreign trade balance for September.
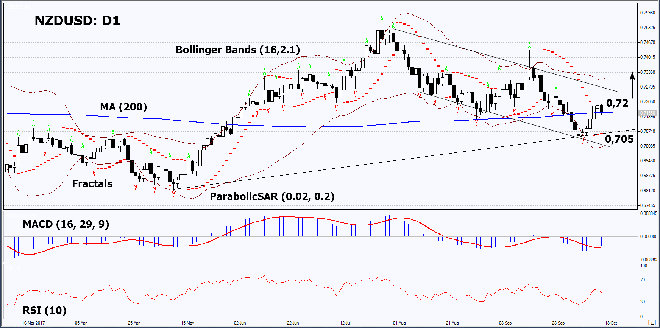
On the daily timeframe, NZDUSD: D1 exceeded the 200-day moving average line and shows a tendency to increase. A number of technical indicators formed signals to rise. At the same time, it continues to remain in the medium-term downward channel. The further price increase is possible in case of the deterioration of the US economy and good economic data in New Zealand.
- The Parabolic indicator gives a bullish signal.
- The Bollinger bands have markedly widened, which indicates high volatility. They are titled upwards.
- The RSI indicator is below 50. No divergence.
- The MACD indicator gives a bullish signal.
The bullish momentum may develop in case NZDUSD exceeds the last high at 0,72. This level may serve as an entry point. The initial stop loss may be placed below the last fractal low and the Parabolic signal at 0,705. After opening the pending order, we shall move the stop to the next fractal low following the Bollinger and Parabolic signals. Thus, we are changing the potential profit/loss to the breakeven point. More risk-averse traders may switch to the 4-hour chart after the trade and place there a stop loss moving it in the direction of the trade. If the price meets the stop level at 0,705 without reaching the order at 0,72, we recommend cancelling the position: the market sustains internal changes that were not taken into account.
Summary of technical analysis
| Position | Buy |
| Buy stop | Above 0,72 |
| Stop loss | Below 0,705 |
- Get Certificate

Note:
This overview has an informative and tutorial character and is published for free. All the data, included in the overview, are received from public sources, recognized as more or less reliable. Moreover, there is no guarantee that the indicated information is full and precise. Overviews are not updated. The whole information in each overview, including opinion, indicators, charts and anything else, is provided only for familiarization purposes and is not financial advice or а recommendation. The whole text and its any part, as well as the charts cannot be considered as an offer to make a deal with any asset. IFC Markets and its employees under any circumstances are not liable for any action taken by someone else during or after reading the overview.
