- Analytics
- Technical Analysis
Currencies vs Dollar Technical Analysis - Currencies vs Dollar Trading: 2018-03-19
Political risks weaken the US dollar
In this review, we suggest considering the personal composite instrument (PCI) &VSUSD_Index. It reflects the price dynamics of the portfolio of major currencies: EUR, GBP, JPY, AUD, CHF, CAD against the US dollar. Will the VSUSD_Index prices fall?
The US currency is weakening amid increased political risks. On March 13, 2018, US President Donald Trump ousted Secretary of State Rex Tillerson. On Friday, March 16, the Washington Post newspaper reported that Trump could fire another member of his team - National Security Adviser Herbert McMaster. Market participants fear that such resignations may make it difficult to carry out the economic reforms of Donald Trump. An additional negative factor for the US dollar is the risk of selling American government bonds by China and other countries against the goods of which the US introduces prohibitive import duties. On Wednesday, March 21, the next Fed meeting will be held during which a rate hike by 0.25% is expected. Theoretically, this can support the US dollar.
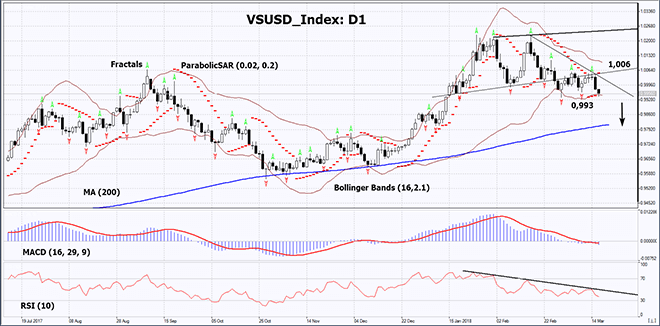
On the daily timeframe, VSUSD_Index: D1 is in a short-term downtrend. The further price decrease is possible in case of the publication of negative economic and political news in the United States.
- The Parabolic indicator gives a bearish signal.
- The Bollinger bands have narrowed, which means low volatility. They are tilted down.
- The RSI indicator is below 50. It has formed a negative divergence.
- The MACD indicator gives a bearish signal.
The bearish momentum may develop in case VSUSD_Index falls below the two last fractal lows and the lower Bollinger band at 0.993. This level may serve as an entry point. The initial stop loss may be placed above the last fractal high and the Parabolic signal at 1.006. After opening the pending order, we shall move the stop to the next fractal high following the Bollinger and Parabolic signals. Thus, we are changing the potential profit/loss to the breakeven point. More risk-averse traders may switch to the 4-hour chart after the trade and place there a stop loss moving it in the direction of the trade. If the price meets the stop level at 1.006 without reaching the order at 0.993, we recommend cancelling the position: the market sustains internal changes that were not taken into account.
Summary of technical analysis
| Position | Sell |
| Sell stop | Below 0.993 |
| Stop loss | Above 1.006 |
- Get Certificate

Note:
This overview has an informative and tutorial character and is published for free. All the data, included in the overview, are received from public sources, recognized as more or less reliable. Moreover, there is no guarantee that the indicated information is full and precise. Overviews are not updated. The whole information in each overview, including opinion, indicators, charts and anything else, is provided only for familiarization purposes and is not financial advice or а recommendation. The whole text and its any part, as well as the charts cannot be considered as an offer to make a deal with any asset. IFC Markets and its employees under any circumstances are not liable for any action taken by someone else during or after reading the overview.
