Chart patterns in Autochartist plugin
Autochartist is an advanced tool for scanning the market and identifying trade inefficiencies (opportunities to gain an advantage when opening positions). The plugin scans the prices of a given set of trading instruments in real time - IFCMarkets provides 125 instruments for calculations. As a result, the most popular chart patterns are automatically determined at different stages of their formation and on different time frames. Of course, the obvious advantage of identifying patterns before they are completely formed is to, at least, set a limit for one's current trade, or enter a position as early as possible on the appropriate signals. But the event of the pattern completion is also quite important, which gives signals for both opening and closing positions. On the main window of the plugin, the "filter" icon opens the "Filters" window, where the objects calculated by the plugin can be configured.

For example, the figure shows emerging and completed patterns that are calculated on M15, M30, H1, H4, D1 timeframes. The plugin calculates patterns: Triangles, Channels, Double Bottom, Double Top, Wedges, Flag, Head and Shoulders, Inverse Head and Shoulders, Pennant, Rectangle. For each pattern found, the Pattern Details table displays the details of the pattern and its quality according to several estimates.
Part 1. List of chart patterns
Here is a complete list of patterns calculated by this plugin.
a) Triangle – this pattern is formed by two slanted lines. The first straight line is formed by declining upper extremes of the price movement, and the second line is formed by rising lower extremes. The triangle is complete when these lines converge at one point. Such a triangle is usually formed on a sideways movement, but at times it is a sign of a trend continuation. Sometimes two types of triangles can be formed - Triangle Bottom and Triangle Top.
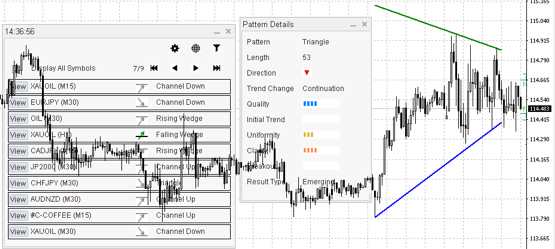
The figure shows the Triangle as well as the table of calculated patterns, from which you can select and see (using the "View" button) the chart you need with an emerging (color icon) or already formed (gray icon) pattern, as well as a table with the quality parameters of this pattern.
b) Ascending Triangle - this pattern is formed by an almost horizontal line from the upper extremes of the price (resistance) and an inclined line from the rising lower extremes (support). Such a triangle is usually a sign of an uptrend.
Read more
c) Descending Triangle - this pattern is formed by an almost horizontal line from the lower extremes of the price (support) and a straight line from the descending upper extremes (resistance). Such a triangle is usually a sign of a downtrend. Read more
Channel Up – the price moves between two rising parallel straight lines.
Channel Down pattern is formed in a similar way - the price moves between two decreasing parallel straight lines. Read more
Double Bottom – two roughly equal price lows. This is a falling to rising trend reversal pattern. Additionally, the plugin draws a line connecting two price lows and, for an already completed pattern, a line connecting the price high within the pattern and the price high of the breakout bar (pattern completion). Read more
Double Top – two roughly equal price peaks. This is a rising to falling trend reversal pattern. Additionally, the plugin draws a line connecting two price highs and, for an already completed pattern, a line connecting the price low within the pattern and the price low of the breakout bar (pattern completion). Read more
a) Falling Wedge – this pattern is formed by two falling and converging sloping lines. The upper straight line is formed by declining upper extremes of the price movement, and the lower line is formed by declining lower extremes. This pattern is preceded by a price trend (of any direction) and is often a signal of an expected upward price breakout.
b) Rising Wedge – this pattern is formed by two growing and converging slopind lines. The upper straight line is formed by rising upper extremes of price movement, and the lower line is formed by rising lower extremes. This pattern is preceded by a price trend (of any direction) and is often a signal of an expected downward price breakout. Read more
Flag – this pattern is formed by the area between two almost parallel (often non-horizontal) lines. The upper line is formed by the upper price extremes, and the lower line is formed by the lower price extremes. The flag is usually a sign of a trend continuation (the figure shows a completed pattern). Read more
Head and Shoulders - three consecutive price peaks, where the central peak is the highest. This pattern is formed at the end of an uptrend and signals a downward trend reversal. Additionally, the plugin draws a line connecting the two extreme tops (shoulders) and a line connecting the lows between the shoulders and the central top (head). Read more
The Inverse Head and Shoulders pattern is formed in a similar way - three consecutive price troughs, where the central trough is the lowest. This pattern is formed at the end of a downtrend and signals an upward trend reversal.
Pennant - this pattern is formed by the area between two converging parallel lines. The upper line is formed by the upper price extremes, and the lower line - by the lower extremes. Moreover, there is often a sharp price movement in the trend direction before the Pennant figure. The pennant is a sign of a trend continuation; after the Pennant, a strong movement towards the trend is expected. Read more
Rectangle - this pattern is formed by the area between two horizontal levels. The upper level is formed by price highs, and the lower level - by price lows. A rectangle is usually a sign of a trend continuation.Read more
Part 2. Pattern assessment
The Pattern Details table displayed on the working area of the chart contains general parameters and pattern quality assessment. The user can open/close this table and move it to a convenient place on the chart.
1. General parameters of the pattern.
“Pattern” - the pattern name.
“Length” – the number of bars forming the pattern.
“Direction” – the signal direction icon (up or down) expected as a consequence of this pattern.
“Trend Change” – the expected trend change (Continuation or Reversal).
“Result Type” – an Emerging or Completed pattern.
2. Pattern quality assessment (each value from 0 to 10):
“Clarity” - the “Clarity” displays the noise level on the price chart (the presence of price spikes reduces the clarity)
“Uniformity” – the “Uniformity” shows a more even distribution of key points on the price chart.
“Quality” – the final quality assessment as the arithmetic mean of all previous assessments.
“Initial Trend” – the “Initial Trend” displays duration and strength of the previous trend.
“Breakout” - the “Breakout” displays the size of the candlestick breaking through the support or resistance level, which means the completion of this pattern.
Part 3. Additional features
The plugin also displays several useful levels.
1. The volatility ranges on the time frames selected in the plugin filter are displayed as a pair of horizontal lines with the time frame name and the numerical value of the price level.
2. The area of expected price moving at completion of some patterns is displayed as a rectangle.
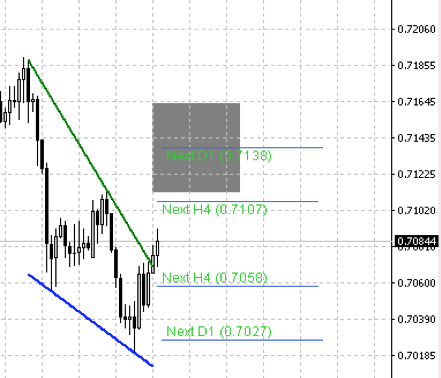
For example, the figure shows two pairs of volatility levels calculated for the H4 and D1 time frames after the Falling Wedge pattern is completed, as well as the expected price growth range.
3. In the “Filteres” window in the “Quantity of historical patterns to show” section, you can set from 1 to 10 patterns calculated earlier than the current pattern (shown by gray lines). This will help the user to see the price dynamics in terms of changing patterns, as well as to study the consequences of the pattern formation.
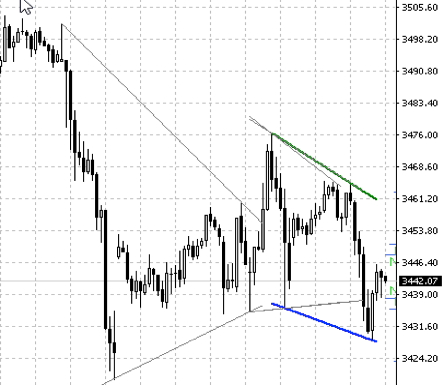
For example, the figure shows an emerging Channel Down pattern, but earlier it was preceded by two completed Triangle patterns.