- تحليلات
- التحليل الفني للسوق
الغاز الطبيعي التحليل الفني - الغاز الطبيعي التداول: 2022-03-23
الغاز الطبيعية ملخص التحليل الفني
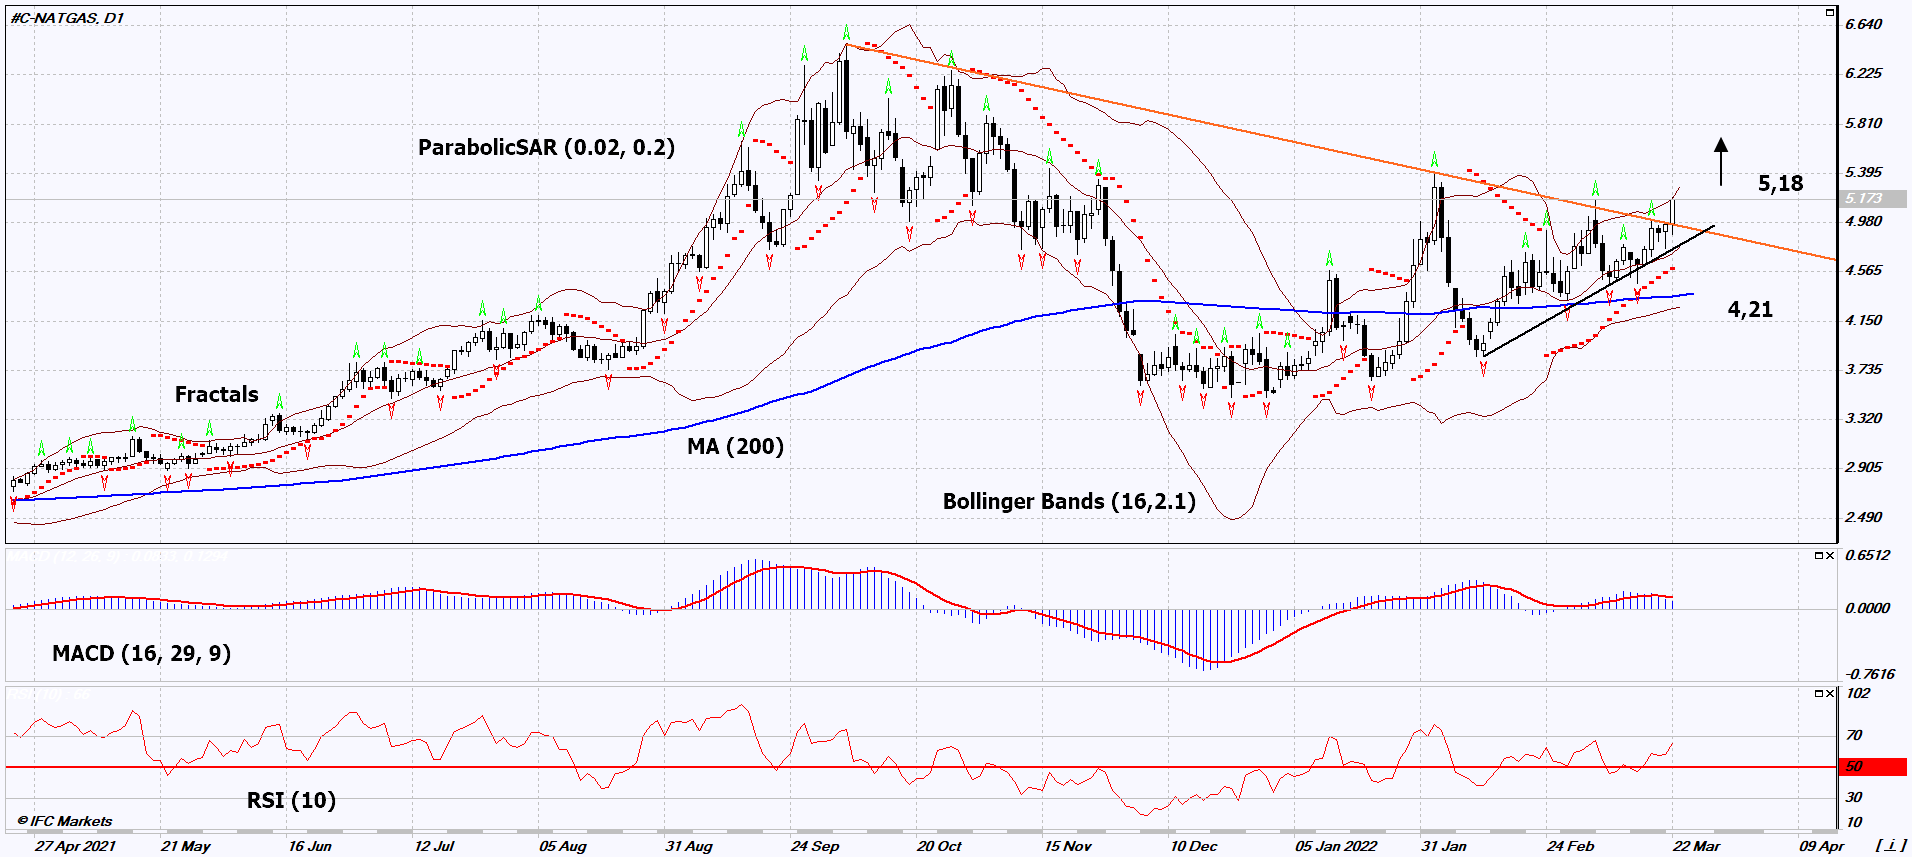
أعلى من 5,18
Buy Stop
أقل من 4,21
Stop Loss
| مؤشر | الإشارة |
| RSI | محايد |
| MACD | بيع |
| MA(200) | محايد |
| Fractals | شراء |
| Parabolic SAR | شراء |
| Bollinger Bands | شراء |
الغاز الطبيعية تحليل الرسم البياني
الغاز الطبيعية التحليل الفني
On the daily timeframe, NATGAS: D1 went up from the triangle. Some technical analysis indicators have formed signals for further growth. We do not rule out a bullish movement if NATGAS rises above the latest high and upper Bollinger band of 5.18. This level can be used as an entry point. Initial risk cap is possible below the last three down fractals, 200-day moving average, Parabolic signal and lower Bollinger band: 4.21. After opening a pending order, we move the stop following the Bollinger and Parabolic signals to the next fractal low. Thus, we change the potential profit/loss ratio in our favor. The most cautious traders after making a trade can switch to a four-hour chart and set a stop loss, moving it in the direction of movement. If the price overcomes the stop level (4.21) without activating the order (5.18), it is recommended to delete the order: there are internal changes in the market that were not taken into account.
التحليل الأساسي لـ السلع - الغاز الطبيعية
Demand for natural gas in the United States has increased. Will the NATGAS quotes continue to rise?
U.S. natural gas cumulative exports hit a record high of 13.77 billion cubic feet on March 19, according to Bloomberg NEF. This happened against the backdrop of EU economic sanctions against Russia and a reduction in European countries' purchases of Russian natural gas. Currently, the cost of liquefied natural gas in Europe and Southeast Asia is almost equal. Formerly U.S. The Energy Information Administration (EIA) announced an increase in US liquefied gas exports in 2021 to a record level of 9.7 billion cubic feet per day. This is 50% more than in 2020. An additional positive for the quotes was the cold snap forecast for the east of the United States, published by the Commodity Weather Group. This may increase the demand for gas for heating.
:تنبيه
يحمل هذا الموجز طابعاً إعلامياً و تعليمياً و تنشر بالمجان . تأتي معظم البيانات المدرجة في الموجز من المصادر العامة معترفة أكثر و أقل موثوقية . مع ذلك ، لا يوجد تأكيد على أن المعلومات المشارة إليها كاملة و دقيقة . لا يتم تحديث الموجز . معظم المعلومات في كل موجز ، تتضمن الرأي و المؤشرات و الرسوم البيانية و أي شيئ اخر وتقدم فقط لأغراض التعريف وليس المشورة المالية أو توصية . لا يمكن اعتبار النص باكماله أو أي جزء منه و أيضاً الرسوم البيانية كعرض لقيام بصفقة بأي اداة . آي إف سي ماركيتس وموظفيها ليست مسؤولة تحت أي ظرف من الظروف عن أي إجراء يتم اتخاذه من قبل شخص آخر أثناء أو بعد قراءة نظرة عامة .


