- Education
- Introduction to Trading
- 2024 Economic Outlook
2024 Economic Outlook
The central theme for 2023 global economic outlook was the likelihood of achieving soft landings for developed economies against the background of synchronized rate hikes by central banks.
Monetary policy makers prioritized reining the global surge in consumer prices that followed massive monetary and fiscal stimulus programs implemented by national governments in the aftermath of economic shutdowns enacted to fight the spread of COVID-19 outbreak.
The United States, which was at the forefront of global push to curtail the spread of the COVID-19, approved stimulus bills beginning in 2020 that amounted to roughly $5 trillion. These federal funding was channeled to individuals and families – $1.8 trillion; businesses - $1.7 trillion; state and local governments - $745 billion; healthcare providers - $482 billion; and others - $288 billion.
In response to the COVID-19 pandemic and economic crisis, Federal Reserve policymakers disbursed $4.7 trillion in monetary support in the form of purchases of long-term US Treasury securities and mortgage-backed securities, provision of US dollars to foreign markets and other types of Federal Reserve lending programs.
Furthermore, Congress passed three pieces of legislation since late 2021 that seek to improve US economic competitiveness, innovation, and industrial productivity - the Bipartisan Infrastructure Law (BIL), the CHIPS & Science Act, and the Inflation Reduction Act (IRA.) They have partially overlapping priorities and together introduce $2 trillion in new federal spending over the next ten years.
The massive spending from several public stimulus programs supported majority of economies around the globe. Data below represent the International Monetary Fund projections for real gross domestic product (GDP) growth in annual percentage changes for major economies.
Global GDP IMF Projections
| 2022 | 2023 | 2024 | |
|---|---|---|---|
| United States | 2.1 | 2.1 | 1.5 |
| Euro Area | 3.3 | 0.7 | 1.2 |
| United Kingdom | 4.1 | 0.5 | 0.6 |
| Japan | 1.0 | 2.0 | 1.0 |
| China | 3.0 | 5.0 | 4.2 |
Source: IMF, October 2023 World Economic Outlook.
After the inflation induced by massive spending programs accelerated in all economies around the globe, major central banks implemented synchronized tightening of monetary policies. The Federal Reserve, the largest among major central banks, hiked federal funds rates by 525 basis points to the range 5.25% - 5.50% between March, 2022 and July,2023. The European Central Bank raised interest rates from -0.5% to 4% in the period from July,2022 to September,2023.
SP500 Outlook
Investors were focused since then on analyzing market data trying to predict when policy makers will shift their stance from restrictive to easier monetary policy. The last meeting of the Federal Reserve in 2023 on December 12-13 signaled the end to Fed’s recent tightening phase.
The stock markets’ reaction was similar around the globe – expectations of lower interest rates boosted stock prices to higher levels. Dow Jones recorded its first record close in almost two years the day Fed chair Jerome Powell said that US central bank’s historic tightening of monetary policy is likely over.
The US economy seems to be heading for a soft landing - falling inflation without unemployment going up drastically and GDP growth going negative. Weekly unemployment insurance claims are not rising while the November retail sales surprise - US retail sales performed much better than expected - confirms strong household spending still supports US economy.
However, going forward US households still face challenges like stagnating real household disposable income, high borrowing costs and the exhaustion of savings accumulated during the post-COVID period.
And while economists project the US economic growth will most likely slow in 2024, the stock market is poised to continue the bullish run in 2024.
The SP500 weekly candles chart analysis below displays the SP500 is close to reclaiming the all-time closing high the benchmark recorded on January 3, 2022. It is clear the index will move beyond that record in the new year.

Figure 1: SP500 weekly candles chart
The likely target for SP500 in 2024 is the 5120 level.
NIKKEI Outlook
Japanese economy will likely slow its growth in 2024 as its top export markets United States and China navigate to manage a soft landing and restart of economy respectively. After unsuccessful efforts to fight deflation since the asset price bubble burst in the early 1990s, Japanese economy recorded the highest rate of inflation in 2023 in almost a decade - an average inflation rate estimated at 3.2 percent.
The NIKKEI weekly candles chart analysis below displays the NIKEI is retracing down after retesting record high. Most likely the Japanese benchmark will remain in the vicinity of the all-time high in 2024.

Figure 2: NIKKEI weekly candles chart
The likely target for NIKKEI in 2024 is the 33901 level.
DE30 Outlook
Euro area economy will likely slow in 2024. European Union private consumption accounted for roughly 52% of EU gross domestic production (GDP) in 2022 with euro area export of goods accounting for about 21.9% of GDP. The European Commission cites weakness in consumption and exports due to high inflation as the reasons for sluggish growth in 2023. The inflation is slowing which will support domestic consumption in 2024.
The DE30 weekly candles chart analysis below displays the movement of the German blue-chip stock benchmark DAX. DE30 is retracing down after hitting record high in mid-December. DE30 most likely will maintain overall bullish trend in 2024.

Figure 3: DE30 weekly candles chart
The likely target for DE30 in 2024 is the 33901 level.
HK50 Outlook
China’s economy underperformed in 2023 as it struggles with economic repercussions from US policy of decoupling from Chinese economy and a sluggish global growth resulting in weak demand for its exports. China is the second largest economy behind European Union in terms of the share of export of goods in GDP – it was 18.2% in 2022.
China’s policy makers are facing a difficult task of supporting the real estate sector where many developers struggle to make payments to creditors both foreign and domestic. China’s Politburo vowed in mid-December a “moderately strengthened” fiscal policy to stimulate economic recovery. China’s economy will most likely slow in 2024.
The HK50 weekly candles chart analysis below displays the movement of the stock benchmark for the Hong Kong Exchange (Hang Seng). Companies from mainland China accounted for 77 percent of Hong Kong Exchange market capitalization in 2022. HK50 is retreating after a rebound in the beginning of 2023. Most likely the benchmark will struggle to reverse the overall bearish trend in 2024.

Figure 4: HK50 weekly candles chart
The likely target for HK50 in 2024 is the 17071 level.
GB100 Outlook
The UK economy has been fluctuating between low growth and small contractions since January 2022 after recovering from huge 20.9 percent decline in GDP in April 2020. After the initial recovery from the aftermath of COVID-19 shutdowns, UK businesses and households struggled with consequences of higher prices. The average weekly food cost for the typical UK household (based on the average 2.36 people per household) in the middle of 2023 was around £103, up around 18% from a year ago. It is double the rate at the turn of the century. The International Monetary Fund downgraded recently UK growth forecast to 0.6% for 2024 from its previous estimate of 1% growth.
The GB100 weekly candles chart analysis below displays the movement of the stock benchmark for the 100 companies listed on the London Stock Exchange with the highest market capitalization (FTSE 100).

Figure 5: GB100 weekly candles chart
The likely target for GB100 in 2024 is the 8135 level.
USDIDX Outlook
The US dollar movement is a major indicator of global economy performance. Federal Open Market Committee of the Federal Reserve sets the rate at which commercial banks borrow and lend their excess reserves to each other overnight. This rate is called the federal funds rate. It is usually set as a target interest rate range, and has direct impact on short term interest rates and the dollar exchange rate.
The fed funds target range is currently 5.25-5.50%. Fed's new 2024 median outlook for the fed funds rate is 4.6%, according to policy makers’ December 13, 2023 interest rate dot plot. This outlook is down 50 basis points from three months ago.
This "dot plot" implies US interest rates will be cut 75 basis points next year, then roughly by around 25 basis points per quarter through 2025 and 2026 until the long-run neutral level of 2.5% is reached.
Analysts note however that the US monetary policy would still be "restrictive" if rates are cut by 75 bps or even 150 bps – compared with the "neutral" rate that neither stimulates nor slows growth or inflation at 2.5%. Federal Reserve rate cuts imply expectation of lower dollar exchange rates in 2024.
The USDIDX weekly candles chart analysis below displays the movement of the US dollar index.

Figure 6: USDIDX weekly candles chart
The likely target for USDIDX in 2024 is the 102.13 level.
EURUSD Outlook
Major central banks face situation similar to that confronting the Federal Reserve. European Central Bank (ECB) policy makers similarly say it is too soon to consider rate cuts. Governing Council member Yannis Stournaras told Reuters that they need to see inflation staying sustainably below 3% by the middle of next year before cutting interest rates. Next day Governing Council member Francois Villeroy de Galhau said the European Central Bank should lower borrowing costs next year after keeping them at their peak long enough to ensure it has beaten down inflation.
So ECB rate cuts are expected next year as inflation falls below 3%. The EURUSD weekly candles chart analysis below displays the movement of the euro vs US dollar.
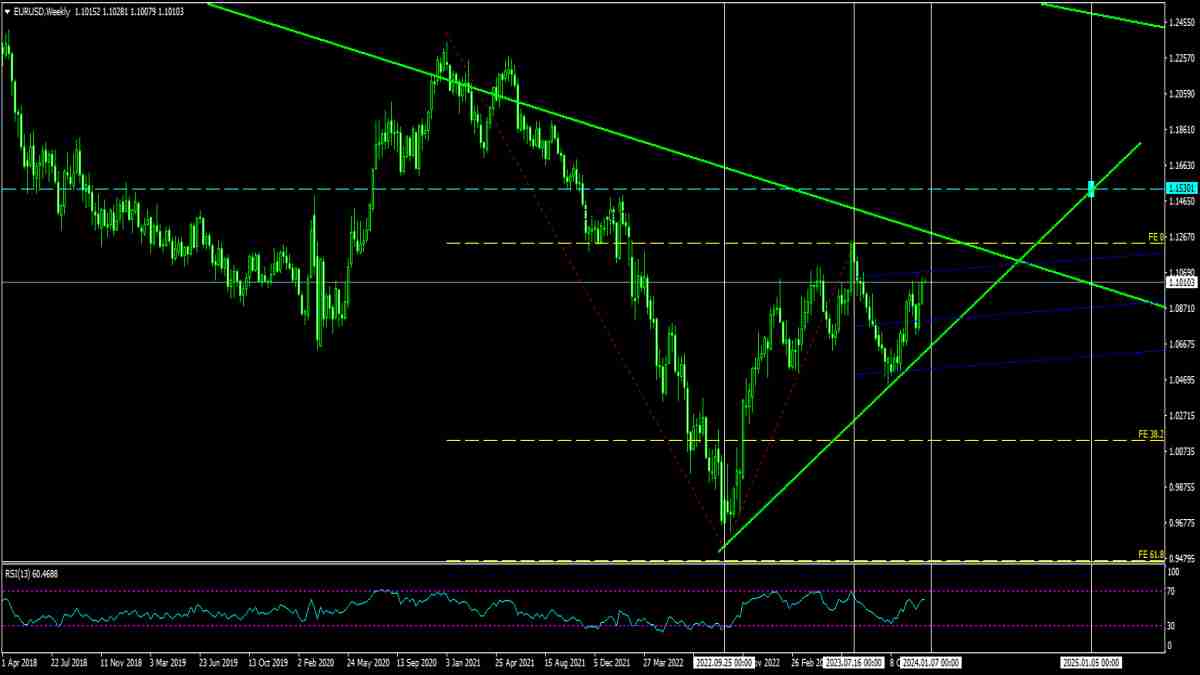
Figure 7: EURUSD weekly candles chart
The likely target for EURUSD in 2024 is the 1.1530 level.
GBPUSD Outlook
Investors are betting that British Pound will be another major currency that will be affected by rate cuts in 2024. The Bank of England held interest rates at a 15-year high of 5.25 per cent on December 14 but warned that there was “some way to go” before inflation slowed sufficiently to consider the mission of the recent rate hikes accomplished. Currently markets are predicting about 115 basis points cut by the BOE next year.
The GBPUSD weekly candles chart analysis below displays the movement of the Pound vs US dollar.

Figure 8: GBPUSD weekly candles chart
The likely target for GBPUSD in 2024 is the 1.3979 level.
USDJPY Outlook
Bank of Japan was the last major central bank that kept interest rates unchanged on December 18 after the Federal Reserve, ECB and BOE did the same before it. BOJ policy makers decided unanimously to keep interest rates at -0.1%, while they also maintained the yield curve policy that references the 1% upper bound for 10-year Japanese government bonds as its limit. While there were comments earlier that the central bank considered normalizing its ultra-loose monetary policy soon, at its last meeting of 2023 BOJ showed little intent to tighten monetary conditions in 2024.
The USDJPY weekly candles chart analysis below displays the movement of the Yen vs US dollar.

Figure 9: USDJPY weekly candles chart
The likely target for USDJPY in 2024 is the 143.704 level.