- Analytics
- Technical Analysis
AUD/USD Technical Analysis - AUD/USD Trading: 2014-12-10
RBNZ Rate Statement
Today we consider AUD/USD currency pair on the H4 chart. The price is moving within the limits of D1 and H4 downtrend channel: bearish trend is observed for all the timeframe scales. Donchian Channel (13) is also demonstrating a negative bias, confirming the trend. At the moment there are no signs of a steady direction looking at the RSI-Bars oscillator: a local overbought level is formed at 53.7114%, which was confirmed three times by the indicator signal. We believe that the formation of a new high below this level will be preceded by the intersection of a fractal price support level at 0.82183. Having reached this level, we would get confirmatory signals: Parabolic values would indicate a bearish slope and Donchian channel would be destroyed. Stop Loss is recommended to be placed above 0.83743, strengthened by the Bill Williams fractal, Parabolic historical values and Donchian Channel upper boundary.
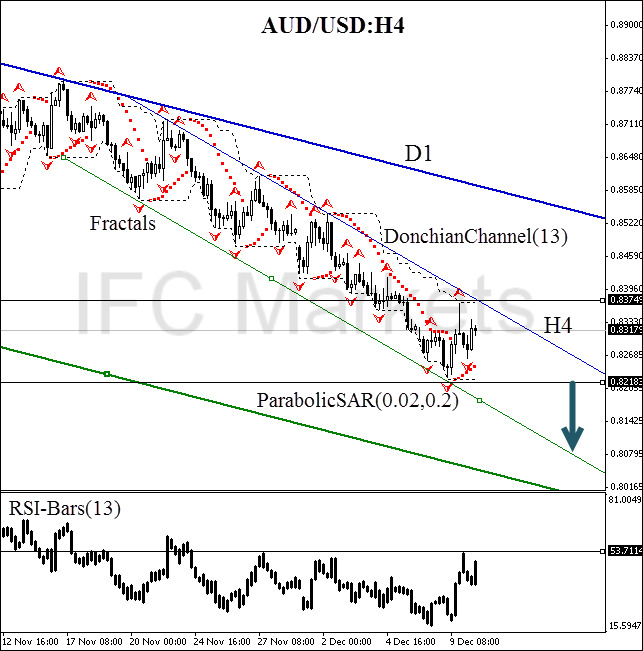
| Position | Sell |
| Sell stop | below 0.82183 |
| Stop loss | above 0.83743 |
Dear traders. For the detailed report of the strategy based on analytical issues of technical analysis click here.
- Get Certificate

Note:
This overview has an informative and tutorial character and is published for free. All the data, included in the overview, are received from public sources, recognized as more or less reliable. Moreover, there is no guarantee that the indicated information is full and precise. Overviews are not updated. The whole information in each overview, including opinion, indicators, charts and anything else, is provided only for familiarization purposes and is not financial advice or а recommendation. The whole text and its any part, as well as the charts cannot be considered as an offer to make a deal with any asset. IFC Markets and its employees under any circumstances are not liable for any action taken by someone else during or after reading the overview.
