- Analytics
- Technical Analysis
AUD/USD Technical Analysis - AUD/USD Trading: 2017-03-17
Improved global economy buoys Australian dollar
The Reserve Bank of Australia didn’t cut the interest rate at its March policy meeting. The Australian dollar is rising after positive recent data. Will the Australian dollar continue strengthening?
The Reserve Bank of Australia (RBA) refrained from cutting the interest rate from 1.5% at its March 7 policy meeting. The central bank stated the economy is continuing its transition following the end of the mining investment boom, expanding by around 2.5% in 2016. Exports have risen strongly and non-mining business investment has risen over the past year. Commodity prices have risen as global economy has improved, supporting Australia’s economic growth. Chinas economy, which is Australia’s main trade partner and export market, continues growing at above 6% annual rate. China has lowered its economic growth target to 6.5% this year as the world's second-largest economy aims to decrease systemic financial risks by lowering company debt levels. Nevertheless Chinese economic growth surpasses growth in other big economies, supporting global growth including Australia’s economy. At the same time President Trump’s protectionist stance and the Federal Reserve monetary tightening pose some risks for Australia’s economy due to worsening trade prospects for Australia’s main partners China, Japan and negative impact of stronger dollar on commodities, Australia’s major exports. On April 4 Australia’s Balance of Trade for February will be released and RBA will announce its interest rate decision.
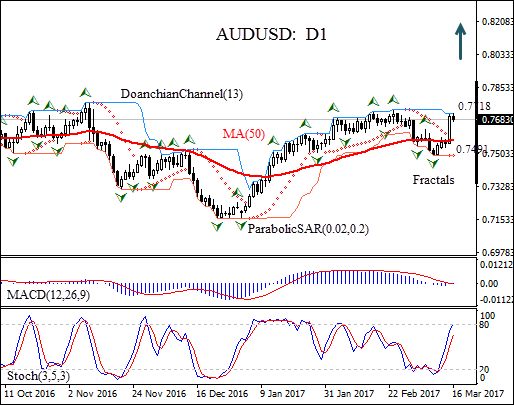
On the daily timeframe AUDUSD: D1 is rebounding after trading with negative bias since it hit two-month high in the end of February. The price has rebounded above the 50-day moving average MA(50).
- The Donchian channel indicates no trend yet: it is flat.
- The Parabolic indicator has formed a buy signal.
- The MACD indicator gives a buy signal.
- The stochastic oscillator is rising and is approaching the overbought zone.
We believe the bullish momentum will continue after the price closes above the upper boundary of Donchian channel at 0.7718. This level can be used as an entry point for placing a pending order to buy. The stop loss can be placed below the last fractal low and Parabolic signal at 0.7491. After placing the order, the stop loss is to be moved every day to the next fractal low, following Parabolic signals. Thus, we are changing the probable profit/loss ratio to the breakeven point. If the price meets the stop loss level (0.7491) without reaching the order (0.7718), we recommend cancelling the position: the market has undergone internal changes which were not taken into account.
Technical Analysis Summary
| Position | Buy |
| Buy stop | Above 0.7718 |
| Stop loss | Below 0.7491 |
Explore our
Trading Conditions
- Spreads from 0.0 pip
- 30,000+ Trading Instruments
- Stop Out Level - Only 10%
Ready to Trade?
Open Account Note:
This overview has an informative and tutorial character and is published for free. All the data, included in the overview, are received from public sources, recognized as more or less reliable. Moreover, there is no guarantee that the indicated information is full and precise. Overviews are not updated. The whole information in each overview, including opinion, indicators, charts and anything else, is provided only for familiarization purposes and is not financial advice or а recommendation. The whole text and its any part, as well as the charts cannot be considered as an offer to make a deal with any asset. IFC Markets and its employees under any circumstances are not liable for any action taken by someone else during or after reading the overview.
