- Analytics
- Technical Analysis
AUD/USD Technical Analysis - AUD/USD Trading: 2018-03-13
Positive statistics support the Australian dollar
Last week, positive data on foreign trade for January 2018 were published in Australia. Will the Australian dollar continue to rise?
On the AUDUSD chart, the strengthening of the Australian currency looks like growth. The trade surplus in January was $A1055 mln, which exceeds market participants’ expectations. Additional positive factors for the Australian dollar were the growth of retail sales in January and the Q4 GDP growth by 2.5% in annual terms. Last week, the Reserve Bank of Australia (RBA) meeting took place. It kept the rate at the current level of 1.5%. According to the RBA forecasts, Australian economic growth may accelerate to 3% in 2018. Currently investors estimate a 50-50 chance of a rate hike by the end of this year. The next RBA meeting will be held on April 3.
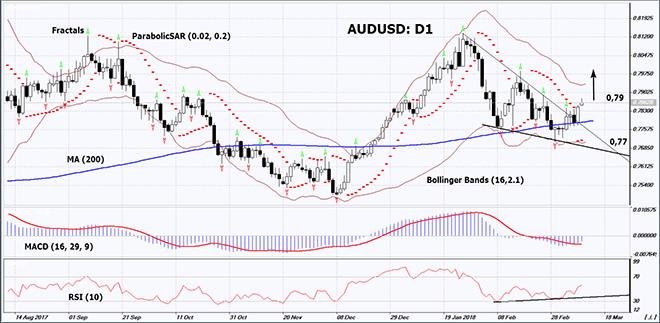
On the daily timeframe, AUDUSD: D1 came out of the short-term downtrend. The further price increase is possible in case of the publication of positive economic data in Australia.
- The Parabolic indicator gives a bullish signal.
- The Bollinger bands have narrowed, which means lower volatility. They are tilted upwards.
- The RSI indicator is above 50. It has formed a positive divergence.
- The MACD indicator gives a bullish signal.
The bullish momentum may develop in case AUDUSD exceeds the last high and the 2nd fractal high at 0.79. This level may serve as an entry point. The initial stop loss may be placed below the last fractal low, the lower Bollinger band and the Parabolic signal at 0.77. After opening the pending order, we shall move the stop to the next fractal low following the Bollinger and Parabolic signals. Thus, we are changing the potential profit/loss to the breakeven point. More risk-averse traders may switch to the 4-hour chart after the trade and place there a stop loss moving it in the direction of the trade. If the price meets the stop level at 0.77 without reaching the order at 0.79, we recommend cancelling the position: the market sustains internal changes that were not taken into account.
Summary of technical analysis
| Position | Buy |
| Buy stop | above 0,79 |
| Stop loss | below 0,77 |
Explore our
Trading Conditions
- Spreads from 0.0 pip
- 30,000+ Trading Instruments
- Stop Out Level - Only 10%
Ready to Trade?
Open Account Note:
This overview has an informative and tutorial character and is published for free. All the data, included in the overview, are received from public sources, recognized as more or less reliable. Moreover, there is no guarantee that the indicated information is full and precise. Overviews are not updated. The whole information in each overview, including opinion, indicators, charts and anything else, is provided only for familiarization purposes and is not financial advice or а recommendation. The whole text and its any part, as well as the charts cannot be considered as an offer to make a deal with any asset. IFC Markets and its employees under any circumstances are not liable for any action taken by someone else during or after reading the overview.
