- Analytics
- Technical Analysis
CAD Currency Index Technical Analysis - CAD Currency Index Trading: 2018-08-28
The Governor of the Bank of Canada said that inflation was under control
In this review, we suggest considering the personal composite instrument (PCI) CAD_Index – currency index of the Canadian dollar. It reflects the price dynamics of the USDCAD against the basket of the world’s major currencies. Will the CAD_Index prices fall?
Such dynamics indicate the weakening of the Canadian dollar against the basket of world currencies. Theoretically, several negative factors can contribute to this. The US and Mexico have entered into a preliminary foreign trade agreement on the revision of the North American Free Trade Agreement (NAFTA). Canada is also involved in this agreement, but is not ready to join the preliminary deal yet on the same terms as Mexico. Let us recall that the tripartite agreement NAFTA was signed in 1992 and has entered into force since 1994. Last year, US President Donald Trump demanded its revision for the purpose of more favorable terms for America. The share of energy products in Canadian exports exceeds 25%. Accordingly, the correction of world oil prices can weaken the Canadian dollar rate. Last week, Brent prices jumped by more than 5%, which caused concern of OPEC and non-OPEC countries. The next meeting of the Bank of Canada will be held on September 5, 2018. Some investors expected a rate hike from the current level of 1.5% after the publication of data on the maximum inflation for 7 years equal to 3% in July. This strengthened the Canadian dollar rate. However, on Friday, August 24, the governor of the Bank of Canada Stephen Poloz said that the surge in inflation is connected with transitional factors, and a more important indicator - the core inflation is within the forecast range. Now, no rate hike is expected. Data on GDP of Canada for the second quarter, which will be released on Thursday, August 30, can affect the dynamics of the Canadian dollar. The preliminary forecasts look very optimistic, which may hinder the decrease of PCI.
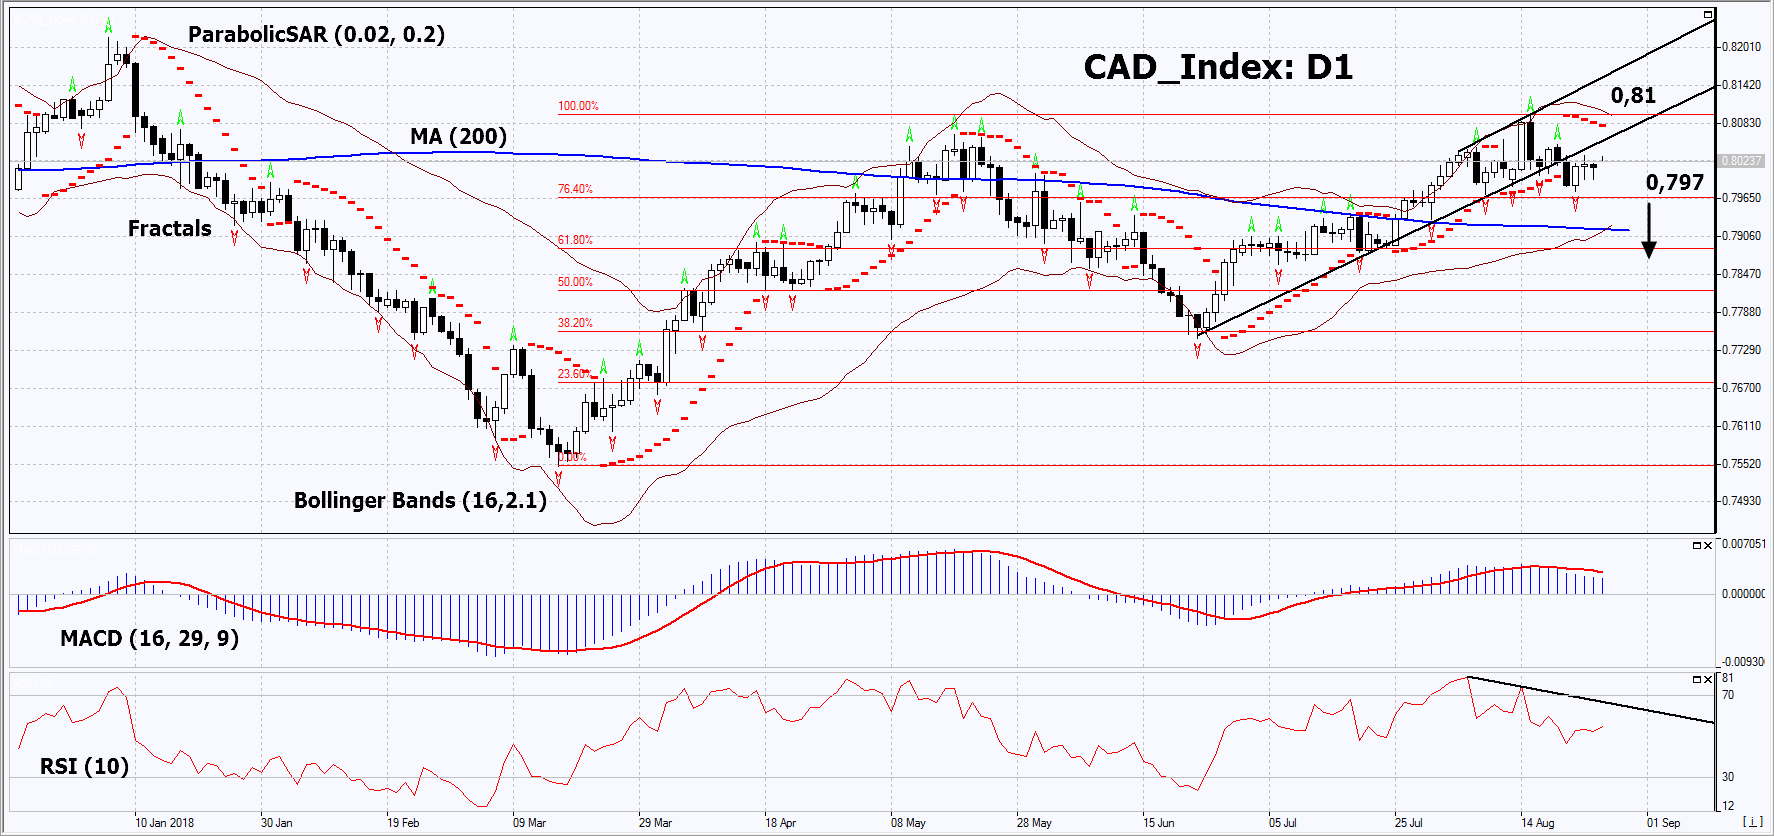
On the daily timeframe, CAD_Index: D1 moved from a rising trend to a neutral one. It must be breached down before opening a sell position. The price decrease is possible in case of negative economic and political news from Canada.
- The Parabolic indicator gives a bearish signal.
- The Bollinger bands have narrowed, which indicates low volatility.
- The RSI indicator is above 50. It has formed a negative divergence.
- The MACD indicator gives a bearish signal.
The bearish momentum may develop in case CAD_Index falls below the 4 last fractal lows and the first level of Fibonacci at 0.797. This level may serve as an entry point. The initial stop loss may be placed above the last fractal high, the 7-month high, the upper Bollinger band and the Parabolic signal at 0.81. After opening the pending order, we shall move the stop to the next fractal high following the Bollinger and Parabolic signals. Thus, we are changing the potential profit/loss to the breakeven point. More risk-averse traders may switch to the 4-hour chart after the trade and place there a stop loss moving it in the direction of the trade. If the price meets the stop level (0.81) without reaching the order (0.797), we recommend to close the position: the market sustains internal changes that were not taken into account.
Summary of technical analysis
| Position | Sell |
| Sell stop | Below 0,797 |
| Stop loss | Above 0,81 |
Explore our
Trading Conditions
- Spreads from 0.0 pip
- 30,000+ Trading Instruments
- Stop Out Level - Only 10%
Ready to Trade?
Open Account Note:
This overview has an informative and tutorial character and is published for free. All the data, included in the overview, are received from public sources, recognized as more or less reliable. Moreover, there is no guarantee that the indicated information is full and precise. Overviews are not updated. The whole information in each overview, including opinion, indicators, charts and anything else, is provided only for familiarization purposes and is not financial advice or а recommendation. The whole text and its any part, as well as the charts cannot be considered as an offer to make a deal with any asset. IFC Markets and its employees under any circumstances are not liable for any action taken by someone else during or after reading the overview.
