- Analytics
- Technical Analysis
Yuan Ruble Technical Analysis - Yuan Ruble Trading: 2017-02-01
US exit from TPP may make yuan stronger
In this report we suggest examining the personal composite instrument (PCI) ”yuan against ruble”. It is rising on the chart when ruble edges lower and when yuan gets stronger against the US dollar. Will CNHRUB continue advancing?
Global oil prices have been advancing since January 2016. As a result, oil prices rose twofold in recent 12 months. In 2016, Russia became the world's major oil producer as it has been extracting almost 11mln barrels of oil each day. These two factors supported Russian ruble against both US dollar and yuan. As a result, CNHRUB has been in downtrend for almost a year. Another negative factor was that yuan lost 4% against the US dollar in recent 12 months as Chinese GDP closed down to 6.7% which is the lowest since 2009. Now the global oil prices stopped rising as lower oil extraction by OPEC is partly compensated for with rising shale oil output in US. Chinese currency strengthened thanks to Donald Trump who announced that US are leaving the TPP. Theoretically, all these factors may trigger upward correction in CNHRUB. The Chinese manufacturing PMI for January, that is due on Wednesday morning, may affect the rate of yuan.
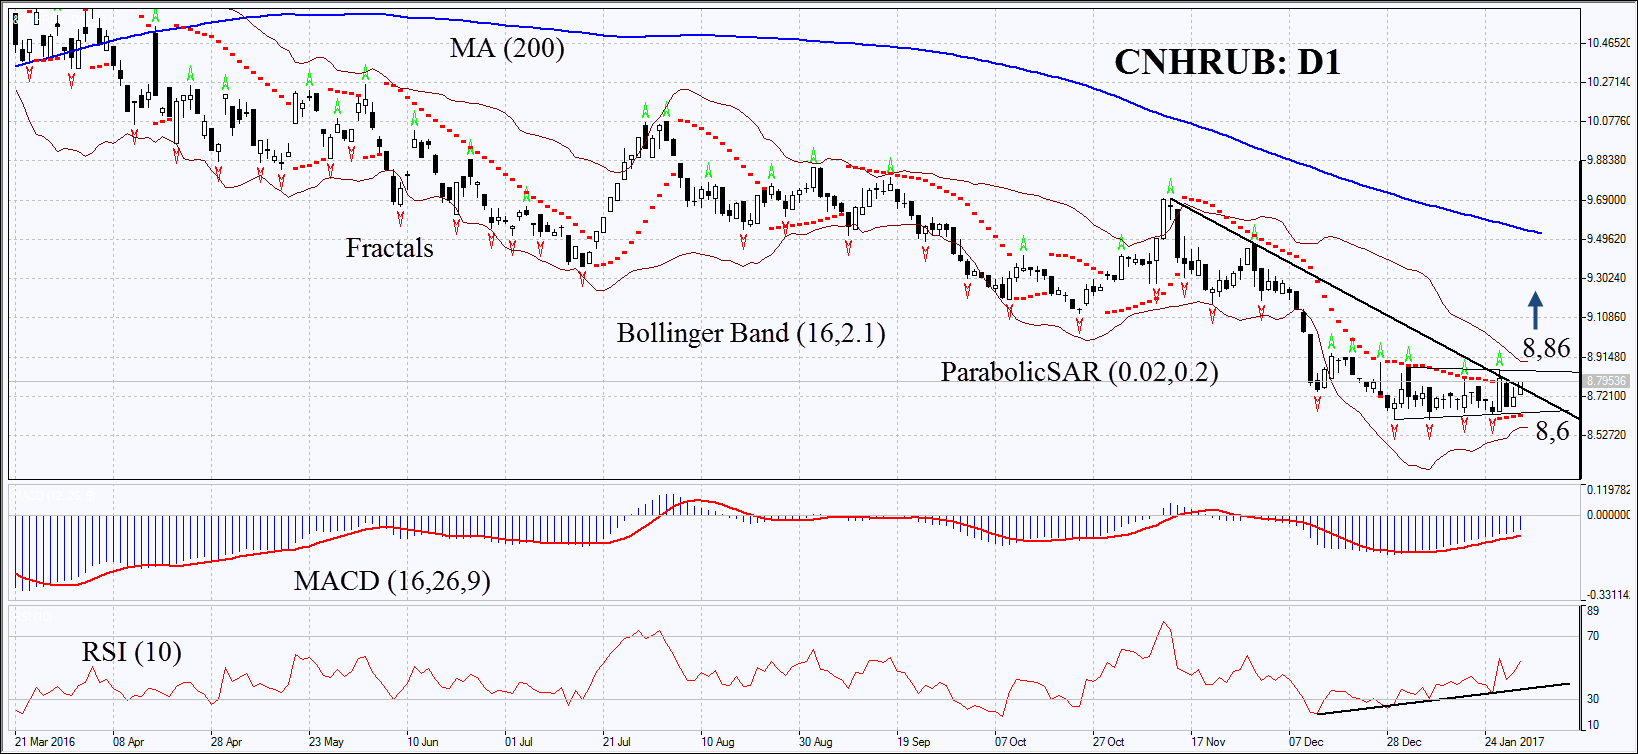
On the daily chart CNHRUB: D1 is correcting down after its long decline. It is moving sideways. Upward correction is probable in case global oil prices stabilize or edge lower and in case the positive economic data come out in China.
- The Parabolic gives bullish signal.
- The Bollinger bands have narrowed a lot which means lower volatility.
- The RSI is above 50 having formed positive divergence.
- The MACD gives weak bullish signals.
The bullish momentum may develop in case CNHRUB surpasses the three last fractal highs and the upper boundary of the neutral channel at 8.86. This level may serve the point of entry. The initial stop-loss may be placed below the 4 last fractal lows and the 18-month low, the Parabolic signal and the lower boundary of the neutral channel at 8.6. Having opened the pending order we shall move the stop to the next fractal low following the Parabolic and Bollinger signals. Thus, we are changing the probable profit/loss ratio to the breakeven point. The most risk-averse traders may switch to the 4-hour chart after the trade and place there a stop-loss moving it in the direction of the trade. If the price meets the stop-loss level at 8.6 without reaching the order at 8.86, we recommend cancelling the position: the market sustains internal changes which were not taken into account.
Summary of technical analysis
| Position | Buy |
| Buy stop | above 8.86 |
| Stop loss | below 8.6 |
Explore our
Trading Conditions
- Spreads from 0.0 pip
- 30,000+ Trading Instruments
- Stop Out Level - Only 10%
Ready to Trade?
Open Account Note:
This overview has an informative and tutorial character and is published for free. All the data, included in the overview, are received from public sources, recognized as more or less reliable. Moreover, there is no guarantee that the indicated information is full and precise. Overviews are not updated. The whole information in each overview, including opinion, indicators, charts and anything else, is provided only for familiarization purposes and is not financial advice or а recommendation. The whole text and its any part, as well as the charts cannot be considered as an offer to make a deal with any asset. IFC Markets and its employees under any circumstances are not liable for any action taken by someone else during or after reading the overview.
