- Analytics
- Technical Analysis
Cocoa Technical Analysis - Cocoa Trading: 2017-02-22
Low demand and prices caused overstorage of cocoa
Coffee and Cocoa Council, the major cocoa producer in Cote-d’Ivoire, points that several companies let export contracts default amid lower global cocoa prices. This caused overstorage of cocoa beans and their spoiling. Some farmers do not reap harvest as they cannot sell their products at fair prices. Will cocoa prices advance?
Cocoa beans prices slumped to the 8-year low last week. In 2016, cocoa lost a third of its price which is the record decline since 1999. Such major price fluctuations have been caused by global cocoa deficit of 150 thousand tonnes in season 2015/16 and prices were high while in season 2016/17 the surplus of 250 thousand tonnes is expected. Previously experts thought that cocoa crops in Cote-d’Ivoire could have risen by 20% to 1.9mln tonnes compared to the previous season and in Ghana by 9% to 850 thousand tonnes. These two countries account for about 60% of global cocoa production. In the nearest future International Cocoa Organization will release its crops outlook which may affect prices. In theory, overstorage of cocoa in Cote-d’Ivoire may force experts to revise down the cocoa production forecasts. Since the start of season 2016/17 on October 1 till February 19 cocoa shipments to sea harbors of Cote-d’Ivoire for export delivery rose just 3% compared to the previous season.
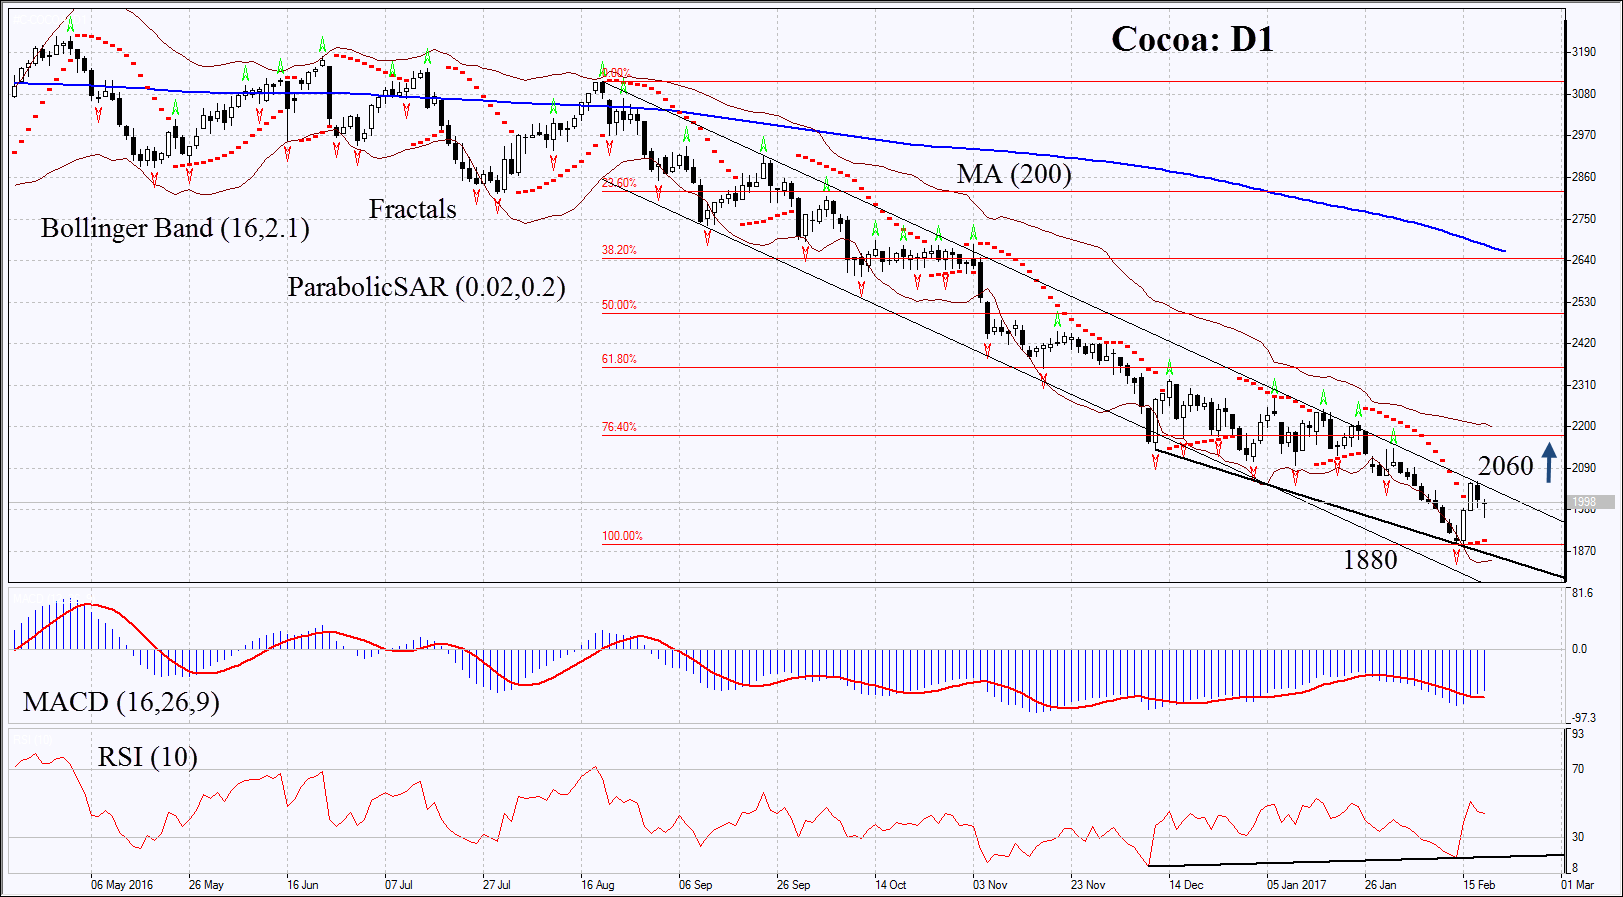
On the daily chart Cocoa: D1 has approached the resistance of the downtrend. Its further decline is possible in case of lower crops forecasts in Cote-d’Ivoire and Ghana.
- The Parabolic indicator gives bullish signals.
- The Bollinger bands have narrowed which means lower volatility.
- The RSI is below 50. It has formed negative divergence.
- The MACD is giving bullish signals.
The bullish momentum may develop in case cocoa surpasses the resistance of the downtrend at 2060. This level may serve the point of entry. The initial stop-loss may be placed below the last fractal low, the 8-1/2-year low and the Parabolic signal at 1880. Having opened the pending order we shall move the stop to the next fractal low following the Parabolic and Bollinger signals. Thus, we are changing the probable profit/loss ratio to the breakeven point. The most risk-averse traders may switch to the 4-hour chart after the trade and place there a stop-loss moving it in the direction of the trade. If the price meets the stop-loss level at 1880 without reaching the order at 2060, we recommend cancelling the position: the market sustains internal changes which were not taken into account.
Summary of technical analysis
| Position | Buy |
| Buy stop | above 2060 |
| Stop loss | below 1880 |
Explore our
Trading Conditions
- Spreads from 0.0 pip
- 30,000+ Trading Instruments
- Stop Out Level - Only 10%
Ready to Trade?
Open Account Note:
This overview has an informative and tutorial character and is published for free. All the data, included in the overview, are received from public sources, recognized as more or less reliable. Moreover, there is no guarantee that the indicated information is full and precise. Overviews are not updated. The whole information in each overview, including opinion, indicators, charts and anything else, is provided only for familiarization purposes and is not financial advice or а recommendation. The whole text and its any part, as well as the charts cannot be considered as an offer to make a deal with any asset. IFC Markets and its employees under any circumstances are not liable for any action taken by someone else during or after reading the overview.
