- Analytics
- Technical Analysis
Cocoa Technical Analysis - Cocoa Trading: 2017-03-14
Drought in South Africa may harm crops
Drought in Cote-d’Ivoire may harm cocoa crops. At the same time demand for cocoa beans may rise in Europe after the Swiss group ECOM acquires the German refiner Euromar Commodities GmbH. Will cocoa prices continue rising?
Previously cocoa crops were expected to rise this agricultural season in Cote-d’Ivoire by about 25% to 2mln tonnes compared to season 2015/16. This made cocoa prices slump by 40% in just 7 latest months to hit a fresh low since October 2008. Theoretically, crops forecast may be revised down on drought. Cote-d’Ivoire accounts for about 36% of global cocoa production. The neighbouring Ghana accounts for another 34% where crops may also suffer on bad weather conditions. Besides lower cocoa beans supply, the demand for them may also rise in Europe. The German Euromar Commodities GmbH cut in Q4 2016 the volume of cocoa beans refinery by 10% because of financial problems. At the same time, the benchmark fell 1% in EU. After Euromar was acquired by the Swiss group ECOM, the volume of refinery may restore. As of March 7, 2017, the net shorts in cocoa at ICE exchange reached the high since 2006 when the information was published first. Their possible closure may provoke the technical price increase.
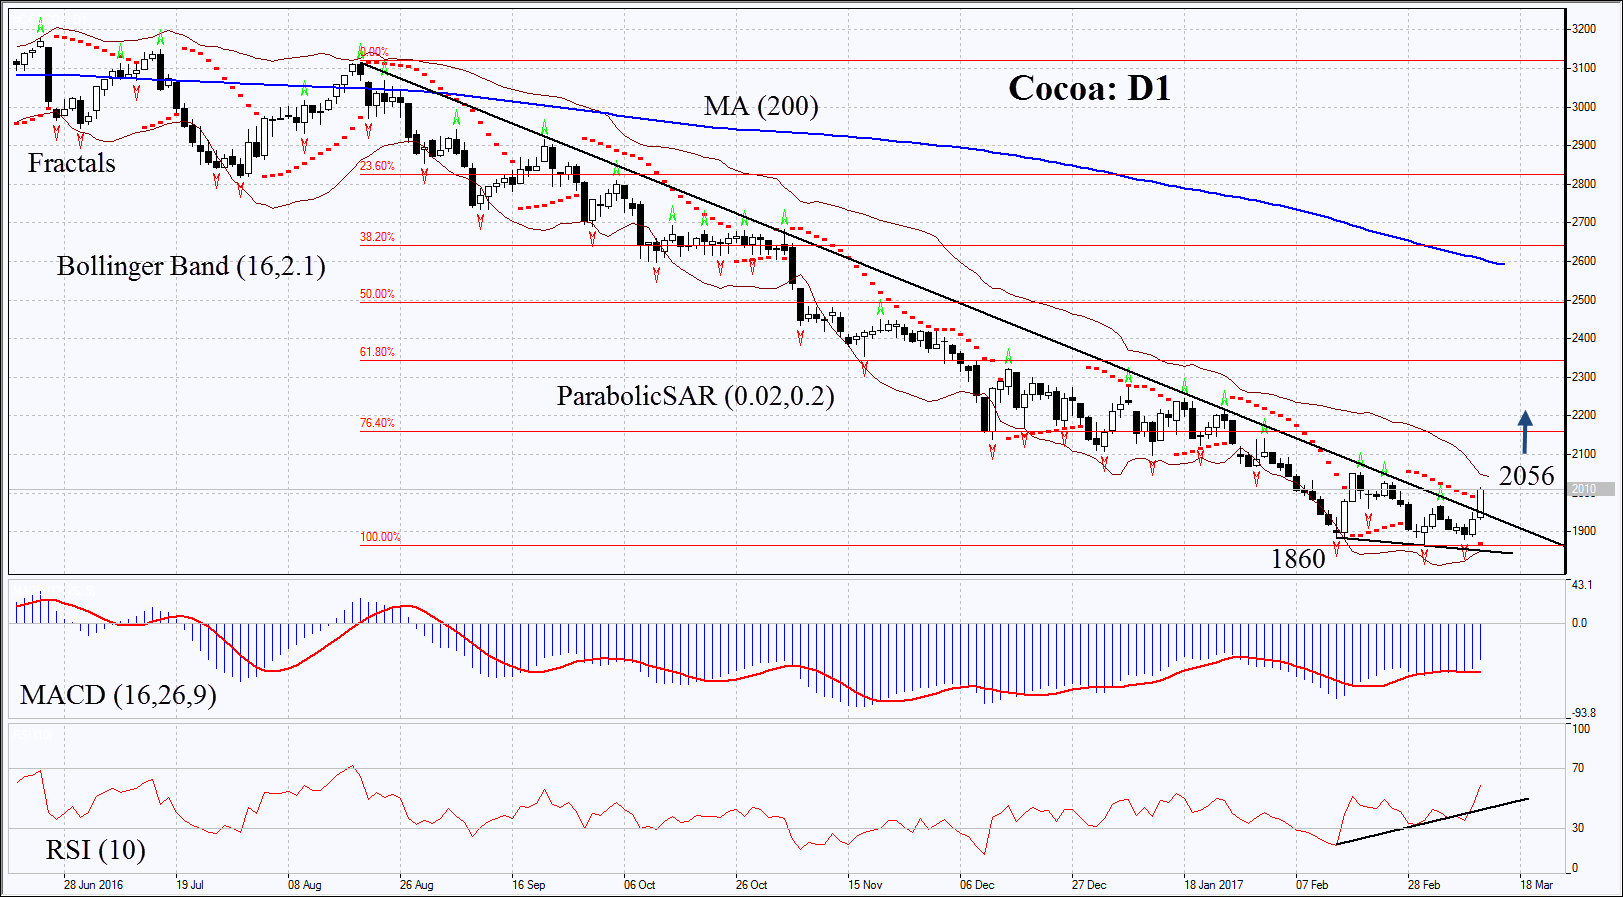
On the daily chart Cocoa: D1 surpassed the resistance of the downtrend. Further price increase is possible in case of lower crops estimates in Cote-d’Ivoire and Ghana and in case of higher demand for beans in Europe.
- The Parabolic indicator gives bullish signal.
- The Bollinger bands have narrowed a lot which means low volatility.
- The RSI is above 50, but has not yet reached the overbought zone. It has formed positive divergence.
- The MACD gives bullish signals.
The bullish momentum may develop in case cocoa surpasses the three last fractal highs and the upper Bollinger band at 2056. This level may serve the point of entry. The initial stop-loss may be placed below the two last fractal lows, the 9-1/2-year low and the Parabolic signal at 1860. Having opened the pending order we shall move the stop to the next fractal low following the Parabolic and Bollinger signals. Thus, we are changing the probable profit/loss ratio to the breakeven point. The most risk-averse traders may switch to the 4-hour chart after the trade and place there a stop-loss moving it in the direction of the trade. If the price meets the stop-loss level at 1860 without reaching the order at 2056, we recommend cancelling the position: the market sustains internal changes which were not taken into account.
Summary of technical analysis
| Position | Buy |
| Buy stop | above 2056 |
| Stop loss | below 1860 |
Explore our
Trading Conditions
- Spreads from 0.0 pip
- 30,000+ Trading Instruments
- Stop Out Level - Only 10%
Ready to Trade?
Open Account Note:
This overview has an informative and tutorial character and is published for free. All the data, included in the overview, are received from public sources, recognized as more or less reliable. Moreover, there is no guarantee that the indicated information is full and precise. Overviews are not updated. The whole information in each overview, including opinion, indicators, charts and anything else, is provided only for familiarization purposes and is not financial advice or а recommendation. The whole text and its any part, as well as the charts cannot be considered as an offer to make a deal with any asset. IFC Markets and its employees under any circumstances are not liable for any action taken by someone else during or after reading the overview.
