- Analytics
- Technical Analysis
Cocoa Technical Analysis - Cocoa Trading: 2018-03-21
Weather improves in West Africa
Since December last year, cocoa prices have risen by about 40% due to the drought in West Africa and reduction in crop forecasts. Now, the rainy season starts in the region. Will cocoa prices decrease?
65% of the world's cocoa is produced only in three West African countries: Cote d'Ivoire (36%), Ghana (24%) and Cameroon (5%). From October 1, 2017 to March 18, 2018, 1,331 million tons of cocoa were delivered to the ports of the main producer Côte d'Ivoire, which is only by 5% less than in the same period of previous years. Meanwhile, in the current season, the average market price of cocoa is about 20% higher. On Monday, its prices collapsed by about 3%, which was the largest daily decline in the current year. According to the forecasts of the International Cocoa Organization, the world surplus of cocoa in the 2017/18 season will decrease to 105 thousand tons compared to the surplus of 300 thousand tons in the previous season. Major chocolate maker Lindt & Sprungli expects a more significant decrease in the surplus to 59 thousand tons. The surplus of production eventually increases the world reserves. According to the International Cocoa Organization, the cocoa crop in Cote d'Ivoire will decrease slightly to 2 million tons in the 2017/18 season from 2.02 million tons in the 2016/17 season. At the same time, a moderate increase in the world demand by 2% is expected. New forecasts may affect the dynamics of prices.
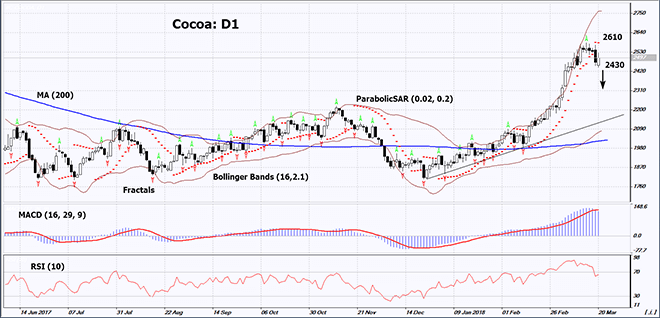
On the daily timeframe, Cocoa: D1 remains in a rising trend, but tries to correct down from its high for a year and a half. The continuation of the downward correction is possible in case of the increased forecasts of the harvest in the countries of West Africa.
- The Parabolic indicator gives a bearish signal.
- The Bollinger bands have widened a lot, which indicates high volatility.
- The RSI indicator is above 50. No divergence.
- The MACD indicator gives a bearish signal.
The bearish momentum may develop in case Cocoa falls below the last low at 2430. This level may serve as an entry point. The initial stop loss may be placed above the last fractal high, the maximum for a year and a half and the Parabolic signal at 2610. After opening the pending order, we shall move the stop to the next fractal high following the Bollinger and Parabolic signals. Thus, we are changing the potential profit/loss to the breakeven point. More risk-averse traders may switch to the 4-hour chart after the trade and place there a stop loss moving it in the direction of the trade. If the price meets the stop level at 2610 without reaching the order at 2430, we recommend cancelling the position: the market sustains internal changes that were not taken into account.
Summary of technical analysis
| Position | Sell |
| Sell stop | Below 2430 |
| Stop loss | Above 2610 |
- Get Certificate

Note:
This overview has an informative and tutorial character and is published for free. All the data, included in the overview, are received from public sources, recognized as more or less reliable. Moreover, there is no guarantee that the indicated information is full and precise. Overviews are not updated. The whole information in each overview, including opinion, indicators, charts and anything else, is provided only for familiarization purposes and is not financial advice or а recommendation. The whole text and its any part, as well as the charts cannot be considered as an offer to make a deal with any asset. IFC Markets and its employees under any circumstances are not liable for any action taken by someone else during or after reading the overview.
