- Analytics
- Technical Analysis
Arabica Coffee Technical Analysis - Arabica Coffee Trading: 2017-03-20
Lower coffee crops are expected in Brazil
Coffee crops are expected to fall 9% in Brazil in 2017/18 agricultural season compared to previous season. Will coffee prices advance?
Rabobank forecasts that coffee crops will fall in Brazil in season 2017/18 to 49.2mln 60-kg bags compared to 54mln bags in 2016/17. The main reason may be the routine pruning of coffee trees. The production of Arabica coffee in Brazil may fall by 12.6% to 36.7mln bags while of robusta – to increase by 4.2% to 12.5mln. Another factor which may support the prices is high demand for coffee in Brazil. The government agency Conab is planning to organize auctions which may help local refiners purchase the ample volume of coffee beans from the agricultural producers. 213.5 thousand of 60-kg bags are needed at this stage, according to Conab. Brazil’s Ministry of Agriculture for the first time considers purchases of robusta coffee in Vietnam. Brazil accounts for more than one third of global coffee crops and produces mainly Arabica variety. The Brazil’s Coffee Exporters Council reports that national coffee exports slumped 9% since July 2016 till February 2017. Vietnam accounts for about 20% of global coffee exports, mainly of robusta variety.
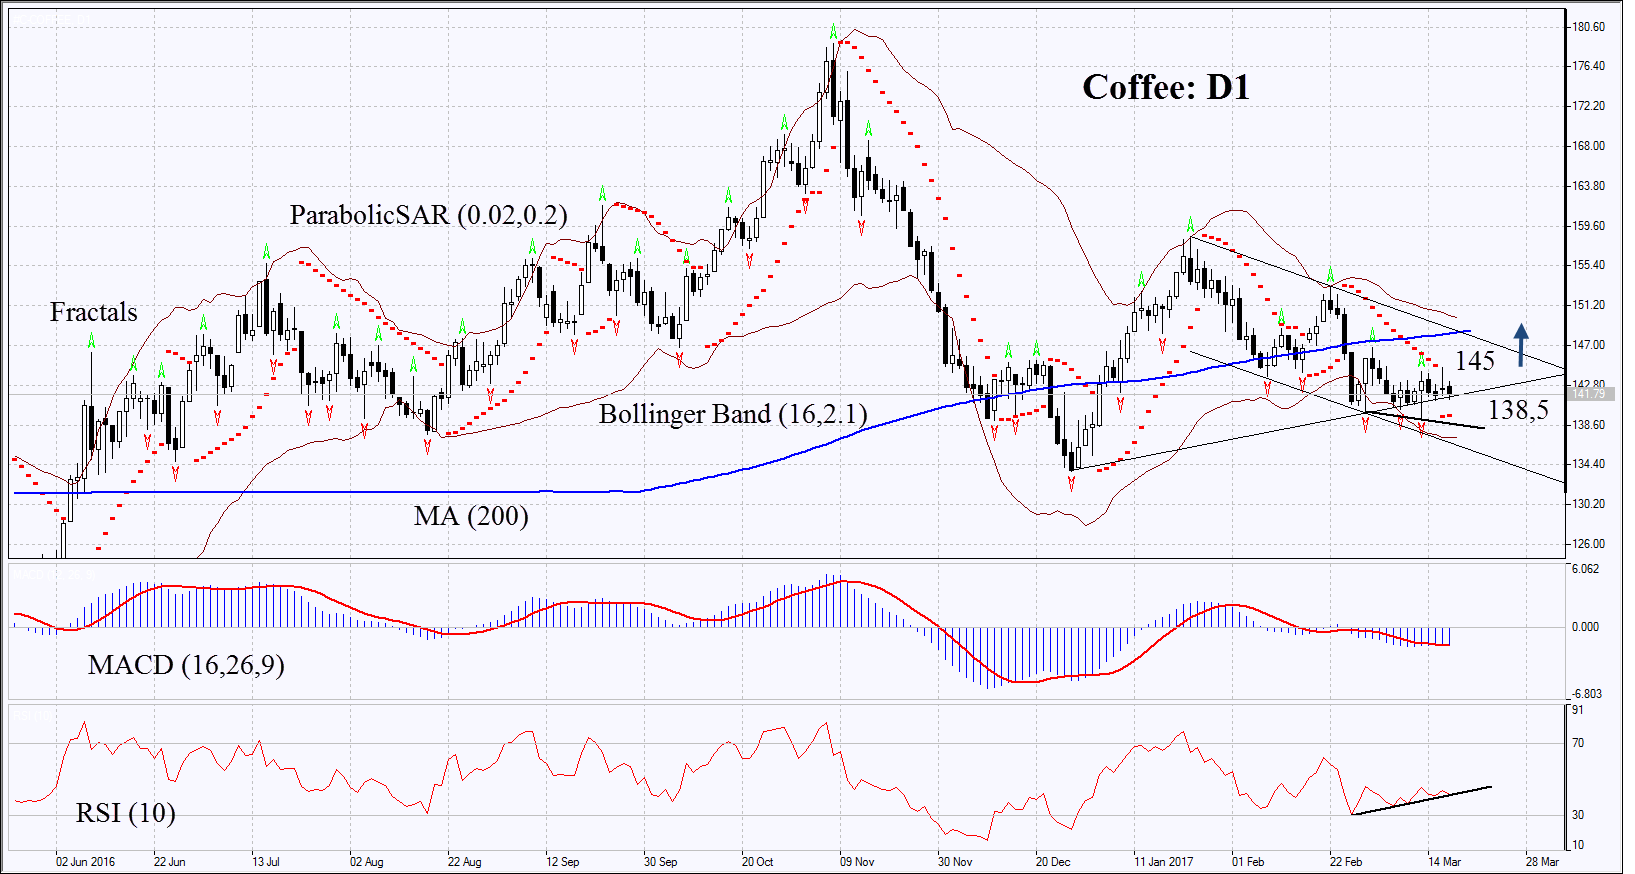
On the daily chart Coffee: D1 reached the lower boundary of the downtrend and started correcting towards the upper boundary. The further price increase is possible in case of lower crops in Brazil and in case of higher demand.
- The Parabolic indicator give bullish signal.
- The Bollinger bands have narrowed which means moderate volatility.
- The RSI is below 50, it has formed positive divergence.
- The MACD is giving bullish signals.
The bullish momentum may develop in case coffee surpasses the last fractal high and the previous high at 145. This level may serve the point of entry. The initial stop-loss may be placed below the Parabolic signal and the last fractal low at 138.5. Having opened the pending order we shall move the stop to the next fractal low following the Parabolic and Bollinger signals. Thus, we are changing the probable profit/loss ratio to the breakeven point. The most risk-averse traders may switch to the 4-hour chart after the trade and place there a stop-loss moving it in the direction of the trade. If the price meets the stop-loss level at 138.5 without reaching the order at 145, we recommend cancelling the position: the market sustains internal changes which were not taken into account.
Summary of technical analysis
| Position | Buy |
| Buy stop | above 145 |
| Stop loss | below 138.5 |
Explore our
Trading Conditions
- Spreads from 0.0 pip
- 30,000+ Trading Instruments
- Stop Out Level - Only 10%
Ready to Trade?
Open Account Note:
This overview has an informative and tutorial character and is published for free. All the data, included in the overview, are received from public sources, recognized as more or less reliable. Moreover, there is no guarantee that the indicated information is full and precise. Overviews are not updated. The whole information in each overview, including opinion, indicators, charts and anything else, is provided only for familiarization purposes and is not financial advice or а recommendation. The whole text and its any part, as well as the charts cannot be considered as an offer to make a deal with any asset. IFC Markets and its employees under any circumstances are not liable for any action taken by someone else during or after reading the overview.
