- Analytics
- Technical Analysis
CORN Technical Analysis - CORN Trading: 2018-12-14
Technical setup bullish for corn prices
Corn technical indicators point to bullish tilt. Will corn prices continue the rebound?
The recent US Department of Agriculture (USDA) WASDE report indicated marginally higher 2018/19 world crop production forecast. Experts however mention a likely lowering of US corn yield estimate in January 11 USDA production forecast. And USDA data show world feed grain stocks, measured by the number of days’ supply excluding China, are falling following lower crops in Europe and Australia. Prices are rising in the last five days with indicators supporting continued bullish momentum.
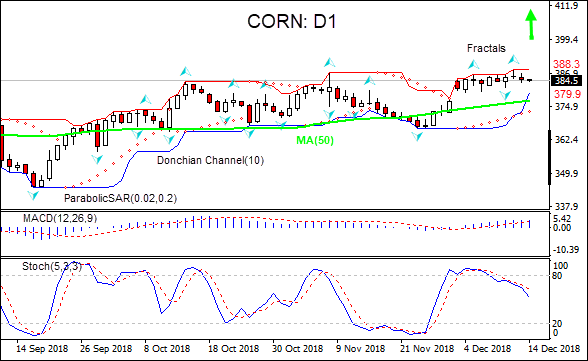
On the daily timeframe CORN: D1 had been retracing after hitting five-month low in mid-September. The price is above the 50-day moving average MA(50).
- The Donchian channel is tilted up indicating uptrend.
- The Parabolic indicator has formed a buy signal.
- The MACD indicator is above the signal line and the gap is narrowing, which is bearish.
- The stochastic oscillator is falling but has not reached the oversold zone.
We believe the bullish momentum will continue after the price closes above the upper boundary of Donchian channel at 388.3. This level can be used as an entry point for placing a pending order to buy. The stop loss can be placed below last fractal low at 379.9. After placing the order, the stop loss is to be moved every day to the next fractal low, following Parabolic signals. Thus, we are changing the expected profit/loss ratio to the breakeven point. If the price meets the stop loss level (379.9) without reaching the order (388.3), we recommend cancelling the order: the market has undergone internal changes which were not taken into account.
Technical Analysis Summary
| Position | Buy |
| Buy stop | Above 388.3 |
| Stop loss | Below 379.9 |
Explore our
Trading Conditions
- Spreads from 0.0 pip
- 30,000+ Trading Instruments
- Stop Out Level - Only 10%
Ready to Trade?
Open Account Note:
This overview has an informative and tutorial character and is published for free. All the data, included in the overview, are received from public sources, recognized as more or less reliable. Moreover, there is no guarantee that the indicated information is full and precise. Overviews are not updated. The whole information in each overview, including opinion, indicators, charts and anything else, is provided only for familiarization purposes and is not financial advice or а recommendation. The whole text and its any part, as well as the charts cannot be considered as an offer to make a deal with any asset. IFC Markets and its employees under any circumstances are not liable for any action taken by someone else during or after reading the overview.
