- Analytics
- Technical Analysis
Cotton Technical Analysis - Cotton Trading: 2018-01-10
Cotton is correcting from the 3.5-year high
On Friday, cotton price updated the 3.5-year high. After that, a small correction started. Will the cotton quotes continue to decline?
On Friday, January 5, 2018, they rose significantly at the beginning of trades, but later slumped by 1.5%. This became the highest daily drop of cotton for the last 2 months (from the end of October 2017). The increased volatility was probably caused by the USDA report. US cotton sales for export increased by 19% in the last week compared with the previous week. However, they were still by 17% less than the 4-week average volume. Cotton prices were previously advancing for 10 consecutive weeks. Respectively, a large amount of speculative Buy positions has been formed on the ICE exchange, according to the U.S. Commodity Futures Trading Commission report. Theoretically, their possible closing may give an additional impulse for the quotes to decrease.
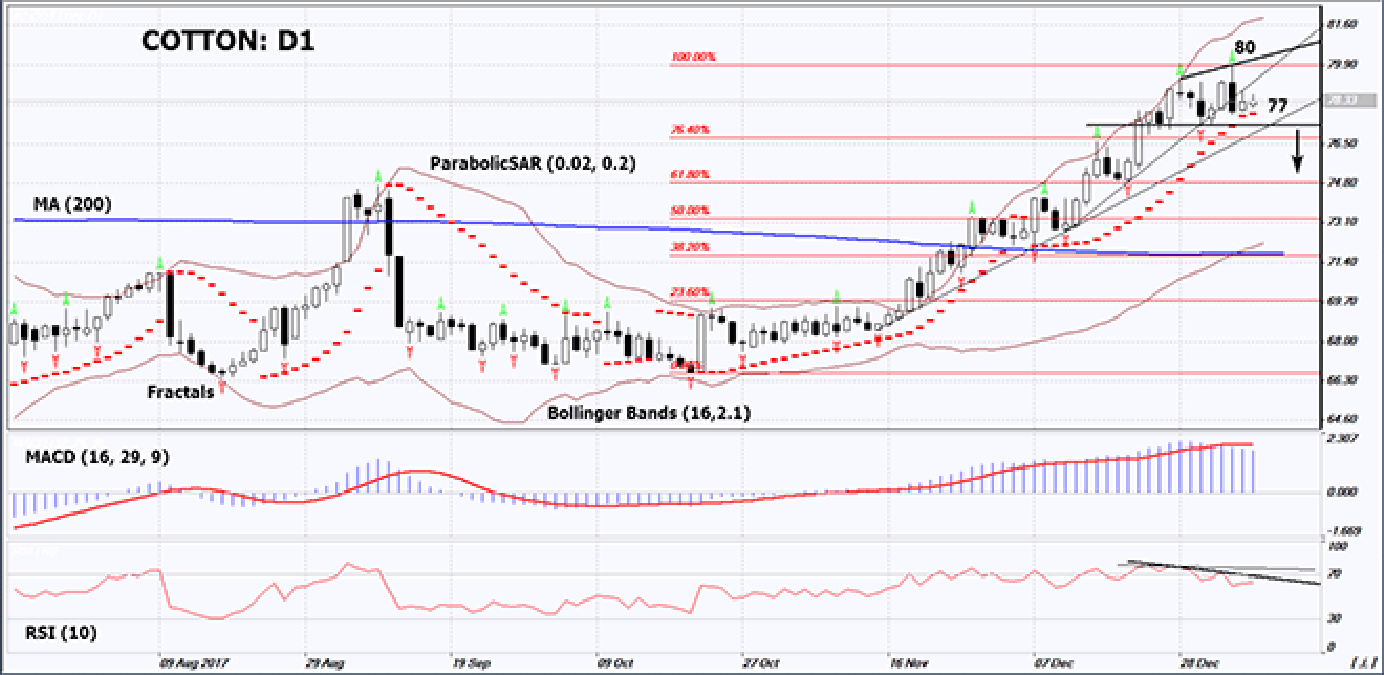
On the daily timeframe, COTTON: D1 maintains the rising trend, but its rate has slowed down. A part of technical indicators formed reversal signals. A downward correction of quotes is possible in case of a decline in global demand.
- The Parabolic indicator gives a bullish signal. It can be uased as an additional support level, which needs to be overcome to open a Sell position.
- The Bollinger bands have markedly widened, which means higher volatility.
- The RSI indicator is above 50. It came out of the overbought zone and has formed a negative divergence.
- The MACD indicator gives a bearish signal.
The bearish momentum may develop in case COTTON drops below the last fractal low at 77. This level may serve as an entry point. The initial stop loss may be placed above the last fractal high, the 3.5-year high and the Parabolic signal at 80. After opening the pending order, we shall move the stop to the next fractal high following the Bollinger and Parabolic signals. Thus, we are changing the potential profit/loss to the breakeven point. More risk-averse traders may switch to the 4-hour chart after the trade and place there a stop loss moving it in the direction of the trade. If the price meets the stop level at 80 without reaching the order at 77, we recommend cancelling the position: the market sustains internal changes that were not taken into account.
Summary of technical analysis
| Position | Sell |
| Sell stop | below 77 |
| Stop loss | above 80 |
Explore our
Trading Conditions
- Spreads from 0.0 pip
- 30,000+ Trading Instruments
- Stop Out Level - Only 10%
Ready to Trade?
Open Account Note:
This overview has an informative and tutorial character and is published for free. All the data, included in the overview, are received from public sources, recognized as more or less reliable. Moreover, there is no guarantee that the indicated information is full and precise. Overviews are not updated. The whole information in each overview, including opinion, indicators, charts and anything else, is provided only for familiarization purposes and is not financial advice or а recommendation. The whole text and its any part, as well as the charts cannot be considered as an offer to make a deal with any asset. IFC Markets and its employees under any circumstances are not liable for any action taken by someone else during or after reading the overview.
