- Analytics
- Technical Analysis
Deutsche Post AG Technical Analysis - Deutsche Post AG Trading: 2020-01-08
Competition intensifies in the German postal market
The competition has intensified in the German postal market. Will Deutsche Post AG stocks fall?American online store Amazon expands its delivery service in Germany. According to Amazon Logistics, a subsidiary of Amazon, it already delivers about a third of all packages to German private customers. The Deutsche Post accounts for 40% of the German market. The third largest postal company in Germany is Hermes. High competition reduces profitability. Let us note that Deutsche Post AG receives 70% of its revenue from the provision of postal services outside Germany and competes there with local companies. In particular, the US and South America account for 18% of revenue and Asia accounts for 17%. The company's annual earnings report will be released on March 10, 2020.
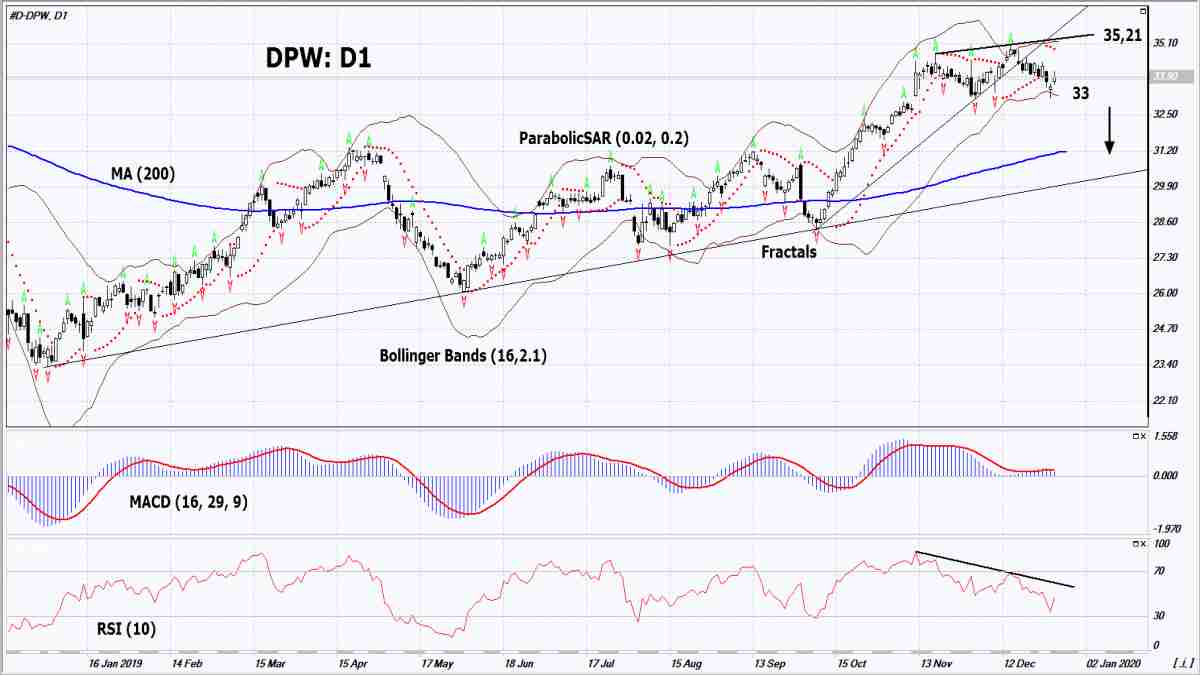
On the daily timeframe, the DPW: D1 breached down the support line of the medium-term uptrend and is traded in a neutral range. A number of technical analysis indicators formed sell signals. It is possible in case of negative news about the company's operating activities during the New Year period.
- The Parabolic indicator gives a bearish signal.
- The Bollinger bands have narrowed, which indicates low volatility. The lower band is titled down.
- The RSI indicator is below 50. It has formed a negative divergence.
- The MACD indicator gives a bearish signal.
The bearish momentum may develop in case DPW falls below the two last fractal lows and the lower Bollinger band at 33. This level may serve as an entry point. The initial stop loss may be placed above the last fractal high, the high since May 2018, the upper Bollinger band and the Parabolic signal 35.21. After opening the pending order, we shall move the stop to the next fractal high following the Bollinger and Parabolic signals. Thus, we are changing the potential profit/loss to the breakeven point. More risk-averse traders may switch to the 4-hour chart after the trade and place there a stop loss moving it in the direction of the trade. If the price meets the stop level (35.21) without reaching the order (33), we recommend cancelling the position: the market sustains internal changes that were not taken into account.
Summary of technical analysis
| Position | Sell |
| Sell stop | Below 33 |
| Stop loss | Above 35.21 |
Explore our
Trading Conditions
- Spreads from 0.0 pip
- 30,000+ Trading Instruments
- Stop Out Level - Only 10%
Ready to Trade?
Open Account Note:
This overview has an informative and tutorial character and is published for free. All the data, included in the overview, are received from public sources, recognized as more or less reliable. Moreover, there is no guarantee that the indicated information is full and precise. Overviews are not updated. The whole information in each overview, including opinion, indicators, charts and anything else, is provided only for familiarization purposes and is not financial advice or а recommendation. The whole text and its any part, as well as the charts cannot be considered as an offer to make a deal with any asset. IFC Markets and its employees under any circumstances are not liable for any action taken by someone else during or after reading the overview.
