- Analytics
- Technical Analysis
EUR/GBP Technical Analysis - EUR/GBP Trading: 2019-07-15
The Bank of England is considering saving or even raising the rate
British pound demonstrated weakening to the euro for 10 weeks in a row. Is its correction possible??
On the EURGBP chart, the weakening of the pound looks like an increase, and a decrease means its strengthening. The British currency weakened due to the fact that the UK did not manage to agree with the European Union on the conditions of the exit, which is to be held on October 31, 2019. In the past few days, the pound began strengthening, as the Bank of England, the only one of the world's major central banks, is considering the option of maintaining or even raising the rate. He explains this by the need to attract investors after the no-deal Brexit. The Bank of England rate is now 0.75% with UK inflation + 2%, and the ECB rate is zero (0%) with Eurozone inflation + 1.2%. The management of the ECB has repeatedly stated plans to further reduce rates in the negative area. An additional positive for the pound could be good British macroeconomic data for May. GDP growth exceeded forecasts and amounted to 1.5%. Industrial production data also turned out to be positive.
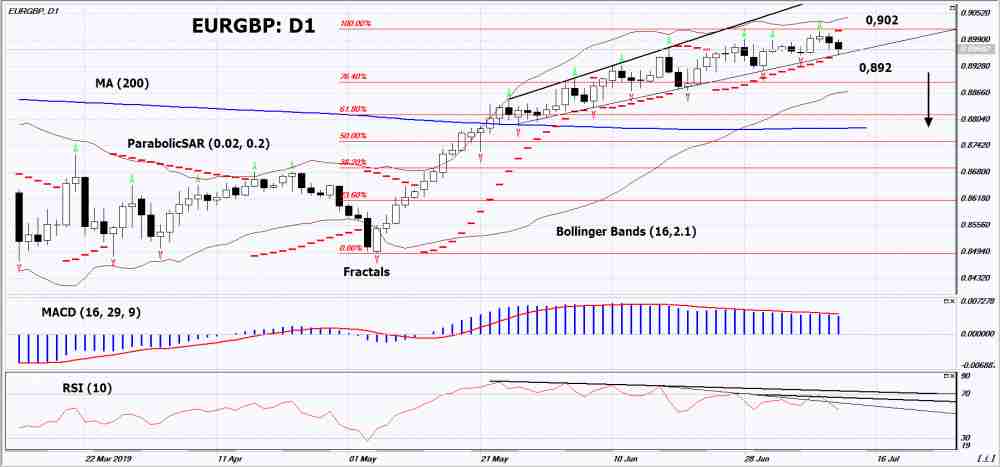
On the daily timeframe EURGBP: D1 approached the mid-term uptrend support line. Before opening a position for sale, it must punch it down. Various technical analysis indicators formed signals to decrease. Further downward correction is possible in case of publication of positive statistics in the UK and negative - in the EU.
- The Parabolic indicator indicates downtrend signal.
- The Bolinger bands narrowed, indicating a volatility decrease.
- The RSI indicator is above the 50 mark. It has formed a divergence to decrease.
- The MACD indicator gives bearish signal.
The bearish momentum may develop if EURGBP drops below the last two lower fractals: 0.892. This level can be used as an entry point. The initial stop lose may be placed higher than the last upper fractal, the maximum since January 2019 and the Parabolic signal: 0.902. After the opening the pending order, stop shall be moved following the the Bollinger and Parabolic signals to the next fractal minimum. Thus, we are changing the expected profit/loss ratio to the breakeven point. If the price meets the stop loss level (0,902) without reaching the order (0,892), we recommend cancelling the order: the market has undergone internal changes which were not taken into account.
Technical Analysis Summary
| Position | Sell |
| Sell stop | Below 0,892 |
| Stop loss | Above 0,902 |
- Get Certificate

Note:
This overview has an informative and tutorial character and is published for free. All the data, included in the overview, are received from public sources, recognized as more or less reliable. Moreover, there is no guarantee that the indicated information is full and precise. Overviews are not updated. The whole information in each overview, including opinion, indicators, charts and anything else, is provided only for familiarization purposes and is not financial advice or а recommendation. The whole text and its any part, as well as the charts cannot be considered as an offer to make a deal with any asset. IFC Markets and its employees under any circumstances are not liable for any action taken by someone else during or after reading the overview.
