- Analytics
- Technical Analysis
EUR/NZD Technical Analysis - EUR/NZD Trading: 2018-09-13
Improving euro area statistics bullish for EURNZD
Euro area Composite PMI rose in August while New Zealand’s trade deficit persisted in July. Will the EURNZD climb continue?
Euro area economic data were positive on balance in last couple of weeks. While the GDP growth remained steady at 0.4% over quarter in second quarter and the industrial production decline remained at 0.1% over month in July, the business activity expansion accelerated in August as evidenced by uptick in Markit’s Composite PMI to 54.5 from 54.3 in July. Meanwhile the New Zealand trade deficit persisted in July and building permits decline accelerated. And the global dairy trade price index decline continued, albeit at slowing rate. Improving euro are statistics while New Zealand data remain weak is bullish for EURNZD.
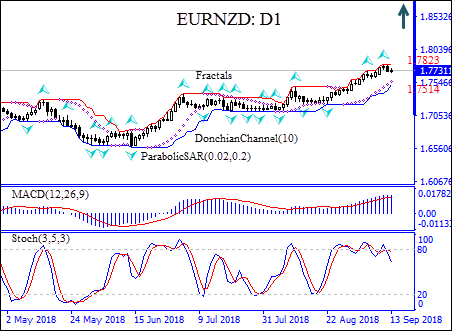
On the daily timeframe EURNZD: D1 is trading with positive bias since beginning of June when it retraced higher after hitting eight-month low.
- The Parabolic indicator has formed a buy signal.
- The Donchian channel indicates uptrend : it is tilted up.
- The MACD indicator gives a bearish signal: it is above the signal line and the gap is narrowing.
- The stochastic oscillator is falling but has not reached the oversold zone.
We believe the bullish momentum will continue after the price breaches above the upper Donchian boundary at 1.7823. This level can be used as an entry point for placing a pending order to buy. The stop loss can be placed below the lower Donchian channel at 1.7514. After placing the pending order the stop loss is to be moved every day to the next fractal low, following Parabolic signals. Thus, we are changing the probable profit/loss ratio to the breakeven point. If the price meets the stop-loss level (1.7514) without reaching the order (1.7823) we recommend cancelling the order: the market sustains internal changes which were not taken into account.
Technical Analysis Summary
| Position | Buy |
| Buy Stop | Above 1.7823 |
| Stop loss | Below 1.7514 |
Explore our
Trading Conditions
- Spreads from 0.0 pip
- 30,000+ Trading Instruments
- Stop Out Level - Only 10%
Ready to Trade?
Open Account Note:
This overview has an informative and tutorial character and is published for free. All the data, included in the overview, are received from public sources, recognized as more or less reliable. Moreover, there is no guarantee that the indicated information is full and precise. Overviews are not updated. The whole information in each overview, including opinion, indicators, charts and anything else, is provided only for familiarization purposes and is not financial advice or а recommendation. The whole text and its any part, as well as the charts cannot be considered as an offer to make a deal with any asset. IFC Markets and its employees under any circumstances are not liable for any action taken by someone else during or after reading the overview.
