- Analytics
- Technical Analysis
EUR/USD Technical Analysis - EUR/USD Trading: 2015-07-13
Awaiting escape from the range
Let us consider the EUR/USD currency pair on the daily chart. Greece achieved a general agreement with international creditors, which lowered the risk that the country will leave the eurozone. The next round of talks will take place July, 16. However, the common currency dropped on expectations of Fed rate hike. That became more likely after Janet Yellen spoke on Friday. The other factor, which weighed on the euro, was the additional bailout volume: it increased to €86bln. It is worth mentioning that important macroeconomic data, including Trade Balance in May and Consumer Price Index in June, will be released in Europe on Thursday. European Central bank will hold a meeting as well. The information may have an impact on currency markets.
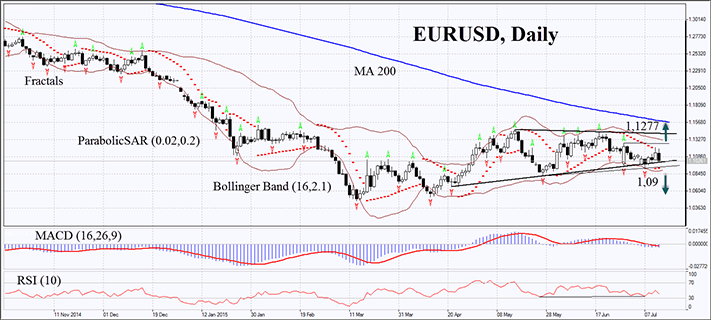
On the daily chart the EUR/USD currency pair is traded in a range, which resembles a triangle pattern. MACD bars are relatively short. The Bollinger bands narrowed. We believe this may indicate low volatility. RSI-Bars has been giving neutral signals. Parabolic has been forming a buy signal, which tends to be weak as long as the price sustains the side trend. We suppose that a trend momentum may develop if the pair escapes the range, spurred by a release concerning Greece or economic statistics. That is why it makes sense to place two or more symmetrical orders. The bullish trend may commence if the price breaches the latest fractal high at 1.1277. The most cautious traders may wait until the chart crosses the second fractal high and the Bollinger band at 1.1435. If the instrument moves below the Parabolic line, the latest fractal low and the Bollinger bands at 1.109, the bearish trend is likely to prevail. If an order triggers, the other one may be canceled since the market has chosen the direction. After pending order activation the stop loss is supposed to be moved every four hours at the next fractal high (short position) or low (long position), following Parabolic signals. The most careful traders are recommended to switch to the H4 time frame and place a stop loss, moving it after the trend. Thus, we are changing the probable profit/loss ratio to the breakeven point.
| Position | Sell |
| Sell stop | below 1.109 |
| Stop loss | above 1.1277 |
| Position | Buy |
| Buy stop | above 1.1277 or 1.1435 |
| Stop loss | below 1.109 |
Explore our
Trading Conditions
- Spreads from 0.0 pip
- 30,000+ Trading Instruments
- Stop Out Level - Only 10%
Ready to Trade?
Open Account Note:
This overview has an informative and tutorial character and is published for free. All the data, included in the overview, are received from public sources, recognized as more or less reliable. Moreover, there is no guarantee that the indicated information is full and precise. Overviews are not updated. The whole information in each overview, including opinion, indicators, charts and anything else, is provided only for familiarization purposes and is not financial advice or а recommendation. The whole text and its any part, as well as the charts cannot be considered as an offer to make a deal with any asset. IFC Markets and its employees under any circumstances are not liable for any action taken by someone else during or after reading the overview.
