- Analytics
- Technical Analysis
EUR/USD Technical Analysis - EUR/USD Trading: 2017-05-15
ECB is not going to tighten monetary policy
On Wednesday, the head of the European Central Bank Mario Draghi announced that it is necessary to continue monetary stimulation of the EU economy. Will the euro fall?
Let us recall that at its regular meeting on April 27, 2017, the ECB maintained low rates and a monthly volume of asset purchases at the level of 60 billion. Thus, its deposit rate is still minus 0.4%, the refinancing rate is zero, and the interest rate on loans is plus 0.25%. Some investors did not exclude that the ECB would confirm the deadlines of its “quantitative easing” program conducted according to the US Federal Reserve’s example. The current level of inflation in the Eurozone is 1.9%. It is already very close to the target level of 2% at which the economic stimulus program should have to be completed. However, Mario Draghi said that despite of its planned completion at the end of this year, the program might be continued if required. An additional negative for the euro may be the data on industrial production for March in the Eurozone. They were published on Friday, May 12, 2017 and appeared to be weaker than forecasts. Next Tuesday, on May 16, significant economic data on GDP and trade balance will be published in the EU.
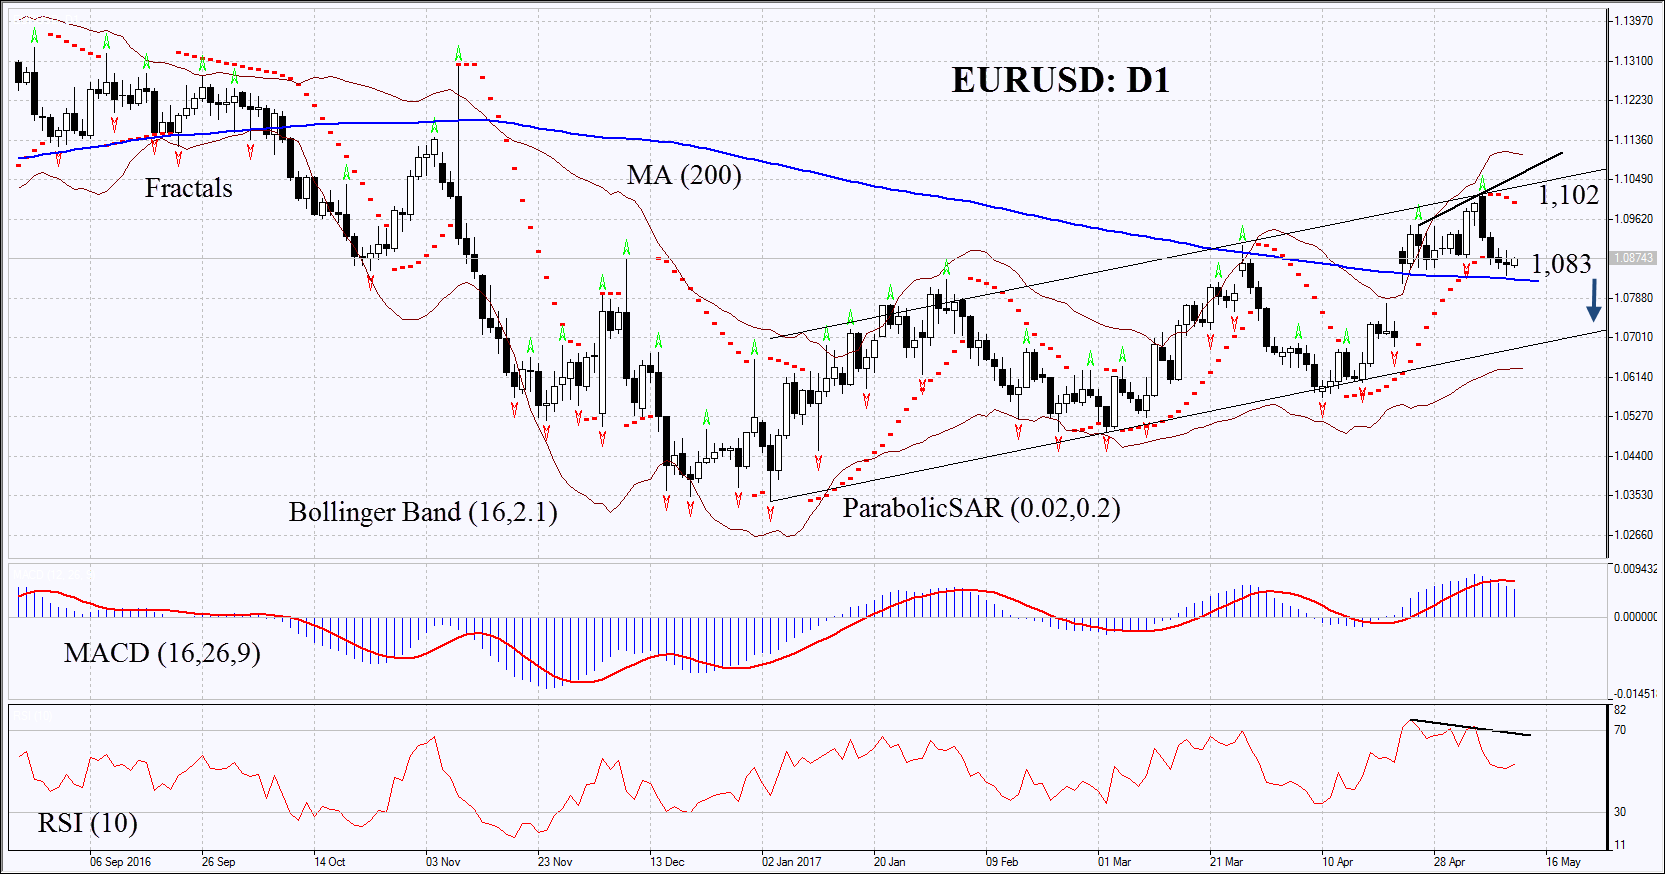
On the daily timeframe, EURUSD: D1 is in an ascending channel. It could not overcome the 6-month high and the resistance line. Now it is trying to correct down. The further decline of euro is possible in case of the publication of weak economic data in the Eurozone or in case of the strengthening of the US dollar.
- The Parabolic indicator is giving a bearish signal.
- The Bollinger bands have widened, which indicates high volatility.
- The RSI indicator is slightly above 50. It has formed a negative divergence.
- The MACD indicator is giving bearish signals.
The bearish momentum may develop in case EURUSD falls below the 200 – day moving average line at 1,083. This level may serve as an entry point. The initial stop-loss may be placed above the last fractal high, the 6-month high and the Parabolic signal at 1,102. After opening the pending order, we shall move the stop to the next fractal high following the Bollinger and Parabolic signals. Thus, we are changing the potential profit/loss to the breakeven point. More risk-averse traders may switch to the 4-hour chart after the trade and place there a stop-loss moving it in the direction of the trade. If the price meets the stop level at 1,102 without reaching the order at 1,083, we recommend cancelling the position: the market sustains internal changes that were not taken into account.
Summary of technical analysis
| Position | Sell |
| Sell stop | below 1,083 |
| Stop loss | above 1,102 |
Explore our
Trading Conditions
- Spreads from 0.0 pip
- 30,000+ Trading Instruments
- Stop Out Level - Only 10%
Ready to Trade?
Open Account Note:
This overview has an informative and tutorial character and is published for free. All the data, included in the overview, are received from public sources, recognized as more or less reliable. Moreover, there is no guarantee that the indicated information is full and precise. Overviews are not updated. The whole information in each overview, including opinion, indicators, charts and anything else, is provided only for familiarization purposes and is not financial advice or а recommendation. The whole text and its any part, as well as the charts cannot be considered as an offer to make a deal with any asset. IFC Markets and its employees under any circumstances are not liable for any action taken by someone else during or after reading the overview.
