- Analytics
- Technical Analysis
FR 40 Technical Analysis - FR 40 Trading: 2020-04-17
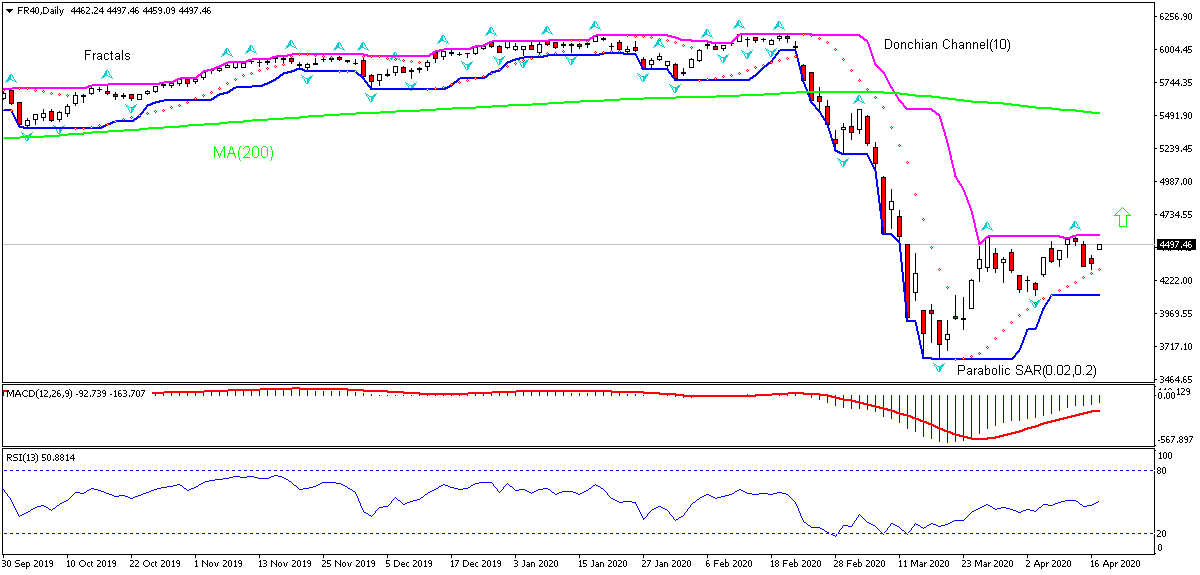
CAC 40 Technical Analysis Summary
Above 4572.84
Buy Stop
Below 4106.45
Stop Loss
| Indicator | Signal |
| RSI | Neutral |
| MACD | Buy |
| Donchian Channel | Neutral |
| MA(200) | Sell |
| Fractals | Buy |
| Parabolic SAR | Buy |
CAC 40 Chart Analysis
CAC 40 Technical Analysis
On the daily timeframe FR40: D1 is rising toward the 200-day moving average MA(200), which is declining itself. We believe the bullish momentum will continue after the price breaches above the upper boundary of Donchian channel at 4572.84. A level above this can be used as an entry point for placing a pending order to buy. The stop loss can be placed below 4106.45. After placing the order, the stop loss is to be moved every day to the next fractal low, following Parabolic signals. Thus, we are changing the expected profit/loss ratio to the breakeven point. If the price meets the stop loss level (4106.45) without reaching the order (4572.84), we recommend cancelling the order: the market has undergone internal changes which were not taken into account.
Fundamental Analysis of Indices - CAC 40
Economic data from France didn’t improve in recent weeks. Will the FR40 rebound continue?
French economic data in the last couple of weeks after the report French economy contracted in fourth quarter of 2019 were weak. While retail sales growth increased in February, the deficits of budget, trade and current account came in bigger than feared. Thus, retail sales growth rose to 3.4% over year in February after 2.6% increase in previous month. However deficits of budget, trade and current account widened to bigger than expected 35.2, 5.2 and 3.8 billion euros respectively in February. At the same time, a smaller than expected slowing in industrial output growth over month in February was a positive development. Weak economic data are downside risk for FR40. Against the background of massive toll the shutdowns exacted on the country’s economy the French government undertook fiscal and monetary stimulus programs to prop flailing businesses. Thus the government announced on March 17 a $49 billion aid package that includes : social security tax cuts, unemployment benefits for people forced to work part time, and a fund to help shopkeepers and the self-employed. At the same a loan guarantee program of up to $327 billion to help businesses was announced. Stimulus programs by numerous developed economies, including the US and European Union, buoyed investors’ confidence, leading to recovery in equity markets.
Explore our
Trading Conditions
- Spreads from 0.0 pip
- 30,000+ Trading Instruments
- Stop Out Level - Only 10%
Ready to Trade?
Open Account Note:
This overview has an informative and tutorial character and is published for free. All the data, included in the overview, are received from public sources, recognized as more or less reliable. Moreover, there is no guarantee that the indicated information is full and precise. Overviews are not updated. The whole information in each overview, including opinion, indicators, charts and anything else, is provided only for familiarization purposes and is not financial advice or а recommendation. The whole text and its any part, as well as the charts cannot be considered as an offer to make a deal with any asset. IFC Markets and its employees under any circumstances are not liable for any action taken by someone else during or after reading the overview.

