- Analytics
- Technical Analysis
GBP/USD Technical Analysis - GBP/USD Trading: 2017-10-26
Accelerating economic growth supports British Pound
UK GDP grew 0.4% in Q3, above expected 0.3% rate. Will the GBPUSD resume strengthening?
UK economy accelerated unexpectedly in the third quarter 2017: Q3 GDP recorded surprise 0.4% growth over quarter when a steady growth of 0.3% was expected. With inflation rising to 3% in September from 2.9% on year in August this raises chances the Bank of England may increase borrowing costs at its November 2 meeting next week.
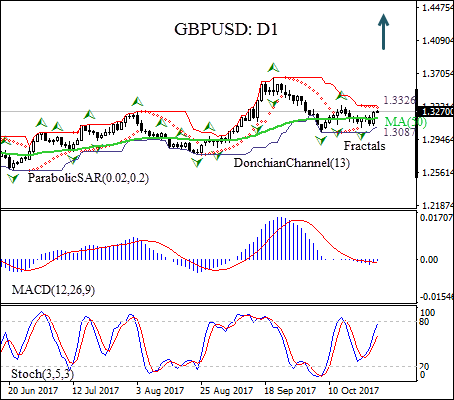
On the daily chart the GBPUSD: D1 has breached above the 50-day moving average MA(50).
- The Parabolic indicator gives a sell signal.
- The Donchian channel indicates an uptrend, it is tilted up.
- The MACD indicator is below the signal line and the gap is narrowing, which is a bullish signal.
- The stochastic oscillator is rising but hasn’t reached the overbought zone.
We believe the bullish movement will continue after the price breaches above the upper Donchian boundary at 1.3326. It can be used as an entry point for a pending order to buy. The stop loss can be placed below the fractal low at 1.3087. After placing the pending order the stop loss is to be moved every day to the next fractal low, following Parabolic signals. Thus, we are changing the probable profit/loss ratio to the breakeven point. If the price meets the stop-loss level (1.3087) without reaching the order (1.3328) we recommend cancelling the position: the market sustains internal changes which were not taken into account.
Technical Analysis Summary
| Position | Buy |
| Buy stop | Above 1.3326 |
| Stop loss | Below 1.3087 |
Explore our
Trading Conditions
- Spreads from 0.0 pip
- 30,000+ Trading Instruments
- Stop Out Level - Only 10%
Ready to Trade?
Open Account Note:
This overview has an informative and tutorial character and is published for free. All the data, included in the overview, are received from public sources, recognized as more or less reliable. Moreover, there is no guarantee that the indicated information is full and precise. Overviews are not updated. The whole information in each overview, including opinion, indicators, charts and anything else, is provided only for familiarization purposes and is not financial advice or а recommendation. The whole text and its any part, as well as the charts cannot be considered as an offer to make a deal with any asset. IFC Markets and its employees under any circumstances are not liable for any action taken by someone else during or after reading the overview.
