- Analytics
- Technical Analysis
Natural Gas Prices Technical Analysis - Natural Gas Prices Trading: 2016-09-08
Average price for Henry Hub gas is expected to be $2.38 per mmBtu this year
Natural gas prices are falling in US after the release of consensus-forecast of its prices for 2016-2017 from major banks. Average price for Henry Hub (Louisiana state) gas is expected to be $2.38 per mmBtu this year and $3.09 in 2017. The data slightly disappointed markets as the average natural gas price since the start of the year is around $2.3. The current price is $2.72 which is far above the consensus-forecast. Will natural gas prices continue falling in the US?
In 2015 the average price was $2.61 per mmBtu which was the lowest since 1999. The average gas price for recent 5 years (2011-2015) is far higher at $3.49. As we see, majority of market participants do not expect it to return to this level soon. The state-backed U.S. Energy Information Administration (EIA) forecasts the US gas prices to be $2.41 this year and $2.95 in 2017, Goldman Sachs bank predicts $2.3 and $3.2. Morgan Stanley and BofA Merrill Lynch banks anticipate slightly higher prices of $2.5 and $3.5. However their forecast for 2016 is anyway below the current one. According to EIA, the average dry natural gas production will be 74.06bn cubic feet a day in US this year and will touch the record level of 2015. In such a case there will be no increase in production for the first time in a decade. Anyway markets are not too worried about it as the consumption is expected to rise just 1.5% to 76.38bn cubic feet a day. The discrepancy, as in previous years, will be covered by means of export. In recent couple of days gas prices are falling on weather forecasts of likely warmer than usually end of year in US. This may push gas prices lower.
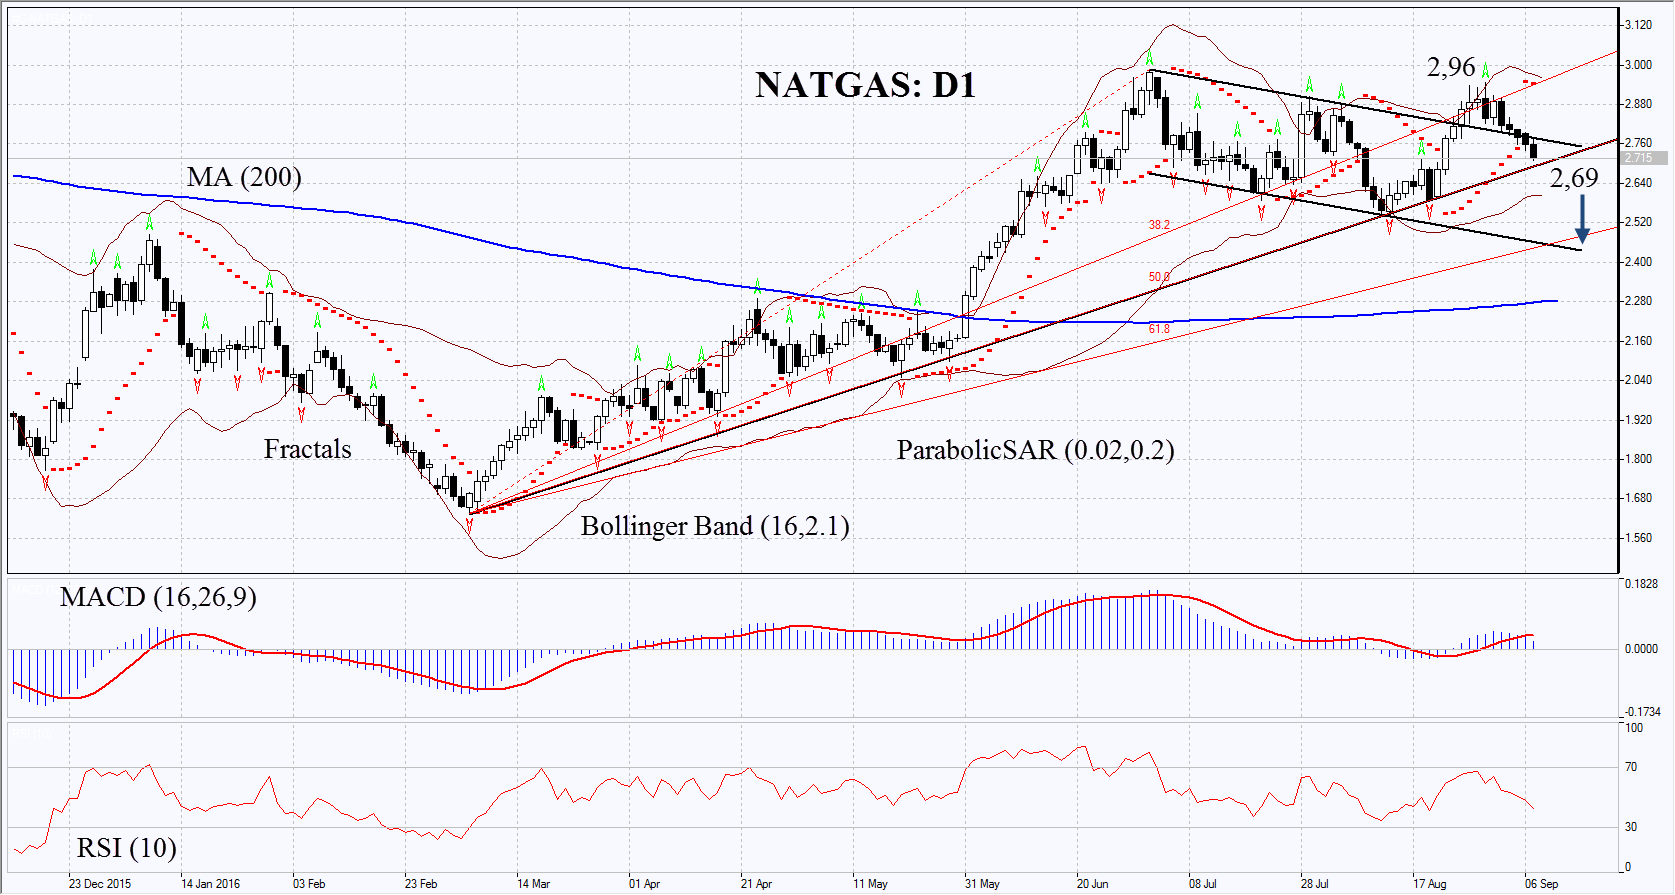
On the daily chart NATGAS: D1 failed to surpass the July high and returned to the descending channel. The downward movement may continue if gas consumption falls of warm weather or if gas production rises.
- Parabolic indicator gives signals to sell.
- Bollinger bands remain quite wide which reflects usual volatility of the asset.
- RSI has fallen below 50, no divergence.
- MACD gives bearish signals.
The bearish momentum may develop in case the natural gas prices fall below the 50% Fibonacci Fan line which aligns with support of the mid-term rising trend at 2.69. This level may serve the point of entry. The initial stop-loss may be placed above the Parabolic signal, Bollinger band and the last fractal high at .... Having opened the pending order we shall move the stop to the next fractal high following the Parabolic and Bollinger signals. Thus, we are changing the probable profit/loss ratio to the breakeven point. The most risk-averse traders may switch to the 4-hour chart after the trade and place there a stop-loss moving it in the direction of the trade. If the price meets the stop-loss level at 2.96 without reaching the order at 2.69, we recommend cancelling the position: the market sustains internal changes which were not taken into account.
Summary of technical analysis
| Position | Sell |
| Sell stop | below 2.69 |
| Stop loss | above 2.96 |
Explore our
Trading Conditions
- Spreads from 0.0 pip
- 30,000+ Trading Instruments
- Stop Out Level - Only 10%
Ready to Trade?
Open Account Note:
This overview has an informative and tutorial character and is published for free. All the data, included in the overview, are received from public sources, recognized as more or less reliable. Moreover, there is no guarantee that the indicated information is full and precise. Overviews are not updated. The whole information in each overview, including opinion, indicators, charts and anything else, is provided only for familiarization purposes and is not financial advice or а recommendation. The whole text and its any part, as well as the charts cannot be considered as an offer to make a deal with any asset. IFC Markets and its employees under any circumstances are not liable for any action taken by someone else during or after reading the overview.
