- Analytics
- Technical Analysis
Nasdaq 100 Technical Analysis - Nasdaq 100 Trading: 2017-03-22
Implementation of economic reforms in US may face hurdles
US stocks fell on Tuesday. Investors booked profits on uncertainty over the timing of implementation of the Trump’s economic program. Will Nasdaq 100 index correct down?
The Trump’s administration has been criticized recently in the US. Market participants began to doubt whether it may undertake a full set of measures to stimulate the US economy. The first step towards the Trump’s program is the cancellation of Obamacare introduced by the previous US president Barack Obama. The voting will take place on Thursday in the US Congress House of representatives. Some congressmen-republicans claim that doubt the reasonability of the rolling the reform back. Investors believe that if Trump’s supporters fail to revoke Obamacare, other economic changes will be questionable. Meanwhile, after Trump’s victory in US presidential elections on November 8, 2016, US stock have been advancing mainly on expectations of the new economic reforms to stimulate the real sector companies. All US indices may correct theoretically. In this report we analyze Nasdaq 100. This week little economic data will come out in US. The Fed Chair Janet Yellen’s speech and the voting on Obamacare may affect the prices. Both events are expected on Thursday.
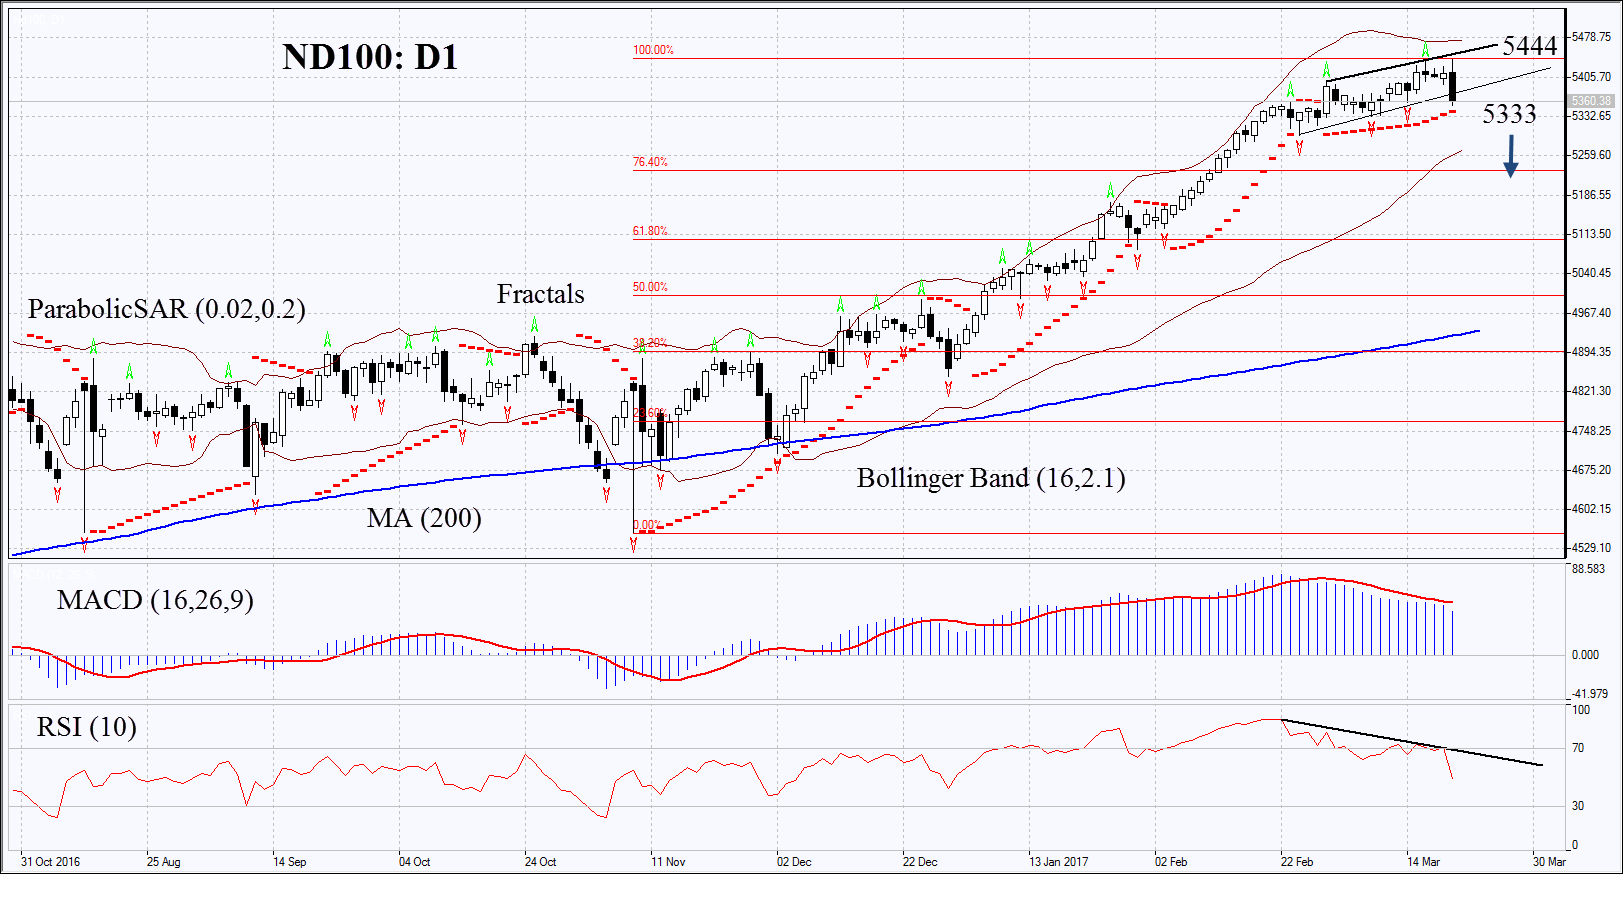
On the daily chart ND100: D1 is struggling to correct down but is still rising. Prices may fall in case of problems with implementation of new economic program by Trump.
- The Parabolic indicator gives bullish signal. It may serve the additional level of support which has to be broken down to open the short position.
- The Bollinger bands have narrowed which means lower volatility.
- The RSI has fallen below 50. It has formed negative divergence.
- The MACD gives bearish signals.
The bearish momentum may develop in case ND100 falls below the two last fractal lows and the Parabolic signal at 5333. This level may serve the point of entry. The initial stop-loss may be placed above the last fractal high and the historical high at 5444. Having opened the pending order we shall move the stop to the next fractal high following the Parabolic and Bollinger signals. Thus, we are changing the probable profit/loss ratio to the breakeven point. The most risk-averse traders may switch to the 4-hour chart after the trade and place there a stop-loss moving it in the direction of the trade. If the price meets the stop-loss level at 5444 without reaching the order at 5333, we recommend cancelling the position: the market sustains internal changes which were not taken into account.
Summary of technical analysis
| Position | Sell |
| Sell stop | below 5333 |
| Stop loss | above 5444 |
Explore our
Trading Conditions
- Spreads from 0.0 pip
- 30,000+ Trading Instruments
- Stop Out Level - Only 10%
Ready to Trade?
Open Account Note:
This overview has an informative and tutorial character and is published for free. All the data, included in the overview, are received from public sources, recognized as more or less reliable. Moreover, there is no guarantee that the indicated information is full and precise. Overviews are not updated. The whole information in each overview, including opinion, indicators, charts and anything else, is provided only for familiarization purposes and is not financial advice or а recommendation. The whole text and its any part, as well as the charts cannot be considered as an offer to make a deal with any asset. IFC Markets and its employees under any circumstances are not liable for any action taken by someone else during or after reading the overview.
