- Analytics
- Technical Analysis
NZD/USD Technical Analysis - NZD/USD Trading: 2019-10-07
Getting ready for trade talks between the US and China
On October 10-11, the next trade talks between the USA and China will start. Will the New Zealand dollar quotations grow?
Deliveries of goods to China account for approximately 20% of New Zealand's exports. Because of this, possible positive factors for the Chinese economy may support the New Zealand currency. US President Donald Trump said that he counts on success in negotiations with China. Another positive factor for the New Zealand dollar may be the good results of the Global Dairy Trade auction of dairy products. Sales volumes increased by 3.7%, and the average price - by 0.2%. Auctions are held 2 times a month, the next will be held on October 15. The dynamics of the New Zealand dollar may be affected by the indicator of business activity in industry (Manufacturing PMI), which will be published on October 11.
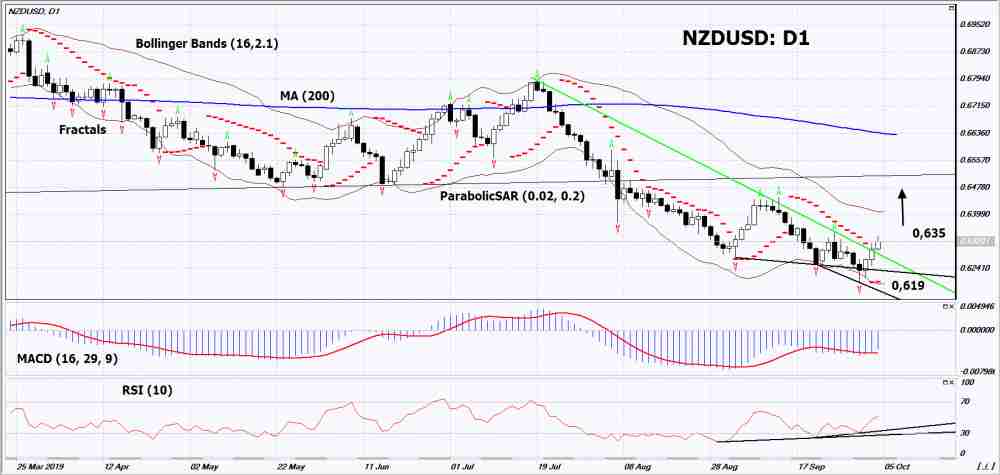
On the daily timeframe NZDUSD: D1 is out of the downtrend up. Various technical analysis indicators have generated signals to increase. Further growth of quotations is possible if positive data is published in New Zealand and success in the US-Chinese trade negotiations.
- The Parabolic indicator demonstrates a signal to increase.
- The Bolinger bands narrowed, indicating a volatility decrease. Both Bollinger Lines Tilt Up.
- The RSI indicator is above the 50 mark. It has formed a double divergence to increase.
- The MACD indicator gives a bullish signal.
The bullish momentum may develop if NZDUSD exceeds its last upper fractal: 0.635. This level can be used as an entry point. Initial stop lose may be placed below the last lower fractal, 4-year low, Parabolic signal and the lower Bollinger line: 0.619. After opening the pending order, the stop shall be moved following the Bollinger and Parabolic signals to the next fractal minimum. Thus, we are changing the potential profit/loss to the breakeven point. More risk-averse traders may switch to the 4-hour chart after the trade and place a stop loss moving it in the direction of the trade. If the price meets the stop level (0,619) without reaching the order (0,635), we recommend to cancel the order: the market sustains internal changes that were not taken into account.
Technical Analysis Summary
| Position | Buy |
| Buy stop | Above 0,635 |
| Stop loss | Below 0,619 |
Explore our
Trading Conditions
- Spreads from 0.0 pip
- 30,000+ Trading Instruments
- Stop Out Level - Only 10%
Ready to Trade?
Open Account Note:
This overview has an informative and tutorial character and is published for free. All the data, included in the overview, are received from public sources, recognized as more or less reliable. Moreover, there is no guarantee that the indicated information is full and precise. Overviews are not updated. The whole information in each overview, including opinion, indicators, charts and anything else, is provided only for familiarization purposes and is not financial advice or а recommendation. The whole text and its any part, as well as the charts cannot be considered as an offer to make a deal with any asset. IFC Markets and its employees under any circumstances are not liable for any action taken by someone else during or after reading the overview.
