- Analytics
- Technical Analysis
Natural Gas vs Oil Technical Analysis - Natural Gas vs Oil Trading: 2019-11-26
Demand for natural gas may decline because of warm weather in the US
In this review, we suggest considering the personal composite instrument (PCI) &SumOIL/GAS. It reflects the price dynamics of the portfolio composed of futures contracts on Brent and WTI crude oils against the US natural gas futures contract.Will the SumOIL/GAS rise?
Such a movement means that oil prices are rising, while natural gas prices are falling. US-China trade negotiations and the OPEC meeting are tha main positive factors for oil. If the United States and China agree to reduce mutual import duties, this may contribute to the revival of their economies and global trade in general. In this case, global oil demand may increase. The OPEC meeting will be held on December 5, 2019. It is expected the agreement on oil output cuts by OPEC+ oil producer countries and non-OPEC oil producers will be extended until mid-2020. This may limit global oil supply. Natural gas prices may fall because of the warm weather forecast this winter in the US. This will reduce the natural gas demand for heating. Let us note that last Friday, gas production in the US updated its historic high and amounted to 95.91 billion cubic feet per day. Earlier, the Energy Information Administration (EIA) published a forecast for gas pries decline next year at Henry Hub.
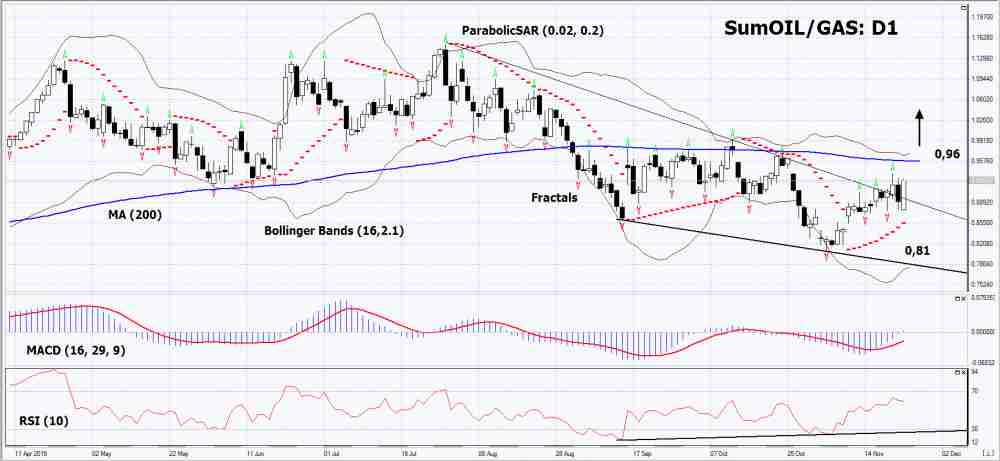
On the daily timeframe, SumOIL/GAS: D1 breached up the resistance line of the downtrend. A number of technical analysis indicators formed buy signals. The further price growth is possible in case of an increase in global oil demand and warm weather in the US.
- The Parabolic indicator gives a bullish signal.
- The Bollinger bands have widened, which indicates high volatility. Both Bollinger bands are titled up
- The RSI indicator is above 50. It has formed a positive divergence.
- The MACD indicator gives a bullish signal.
The bullish momentum may develop in case SumOIL/GAS exceeds its last fractal high and the 200-day moving average line at 0.96. This level may serve as an entry point. The initial stop loss may be placed below the 10-month low and the Parabolic signal at 0.81. After opening the pending order, we shall move the stop to the next fractal low following the Bollinger and Parabolic signals. Thus, we are changing the potential profit/loss to the breakeven point. More risk-averse traders may switch to the 4-hour chart after the trade and place there a stop loss moving it in the direction of the trade. If the price meets the stop level (0.81) without reaching the order (0.96), we recommend closing the position: the market sustains internal changes that were not taken into account.
Summary of technical analysis
| Position | Buy |
| Buy stop | Above 0.96 |
| Stop loss | Below 0.81 |
Explore our
Trading Conditions
- Spreads from 0.0 pip
- 30,000+ Trading Instruments
- Stop Out Level - Only 10%
Ready to Trade?
Open Account Note:
This overview has an informative and tutorial character and is published for free. All the data, included in the overview, are received from public sources, recognized as more or less reliable. Moreover, there is no guarantee that the indicated information is full and precise. Overviews are not updated. The whole information in each overview, including opinion, indicators, charts and anything else, is provided only for familiarization purposes and is not financial advice or а recommendation. The whole text and its any part, as well as the charts cannot be considered as an offer to make a deal with any asset. IFC Markets and its employees under any circumstances are not liable for any action taken by someone else during or after reading the overview.
