- Analytics
- Technical Analysis
Orange Juice Technical Analysis - Orange Juice Trading: 2017-02-16
Brazilian orange juice stocks lowest on record
Frozen orange juice stocks fell to 497.4 thousand tonnes at the end of December 2016 compared to 728.9 thousand tonnes in the same period of 2015. Will orange juice prices advance?
Its stocks in Brazil at the end of last year were the lowest since record started in 2000. According to CitrusBR, they will continue falling this year. The main reason for such a trend is weak crops in the recent two years. It is expected to fall even more in 2017. Orange crops in Brazil may dip to 244mln of 90-lbs boxes (each box is 40.8kg) which is the 28-year low. Crops were 300mln boxes last year. The additional negative factor is lower orange quality. On average, 250 boxes were needed to produce one tonne of frozen juice. Now 288 boxed are needed. Brazil accounts for 60% in global orange juice production thus being the leader. The US rank 2nd and also expect lower crops. In season 2016/17 124.8mln boxes of oranges will be harvested, according to USDA. The crops were 137.5mln boxes in season 2015/16 and 146.6mln in season 2014/15.
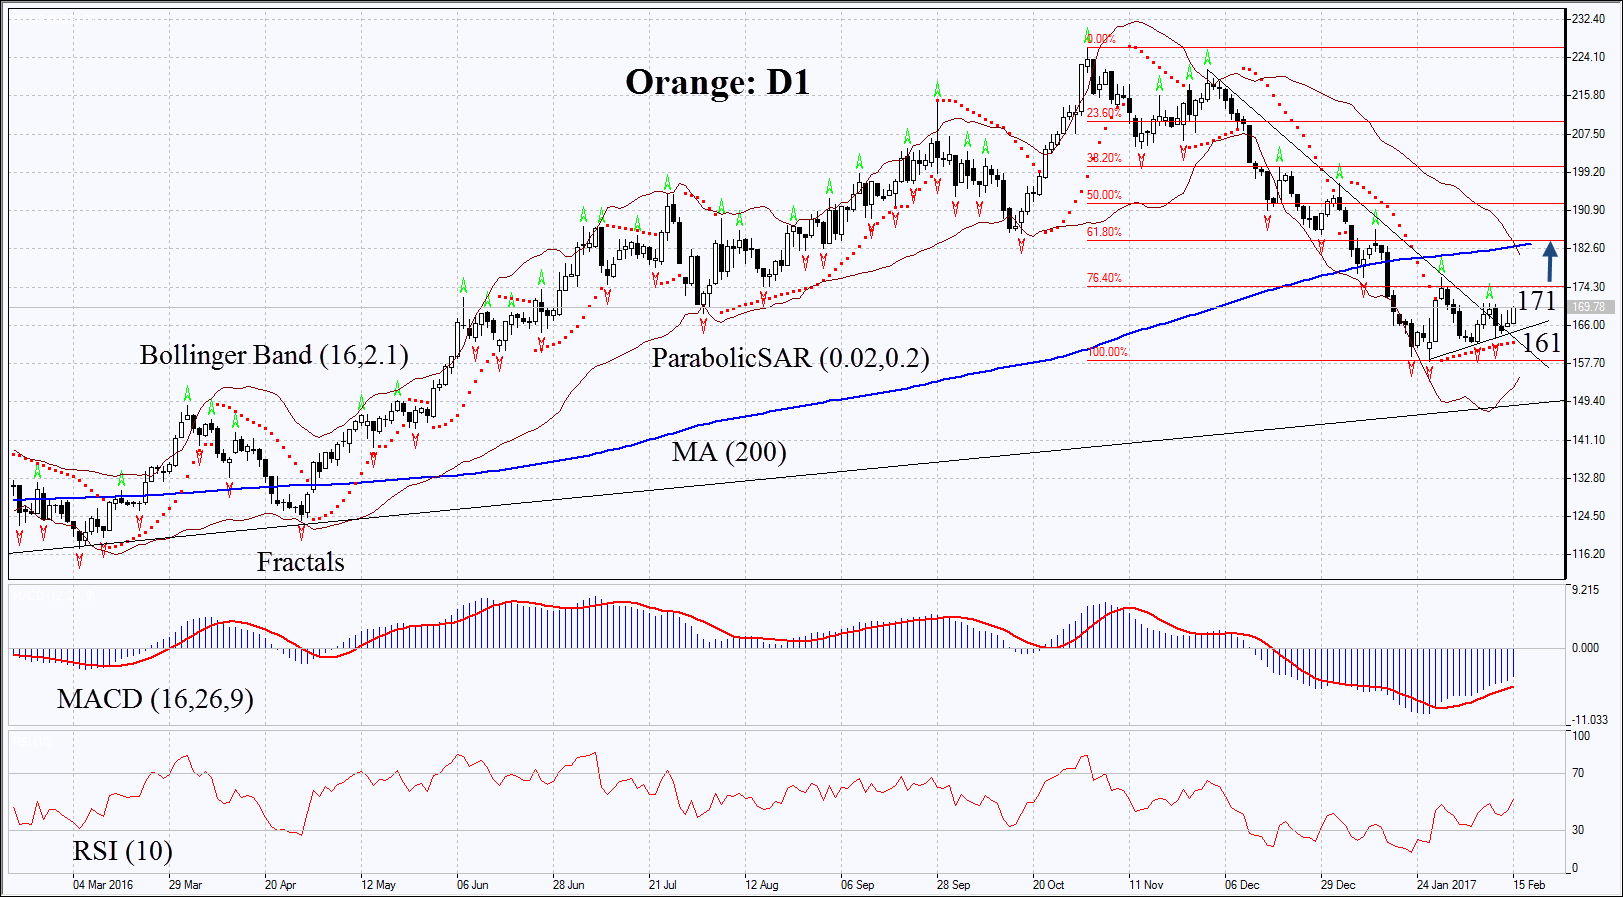
On the daily chart Orange: D1 has left the descending trend to move upwards. Its further increase is possible in case of weak crops in Brazil and US this season in case the strong global demand persists.
- The Parabolic indicator gives bullish signal.
- The Bollinger bands have narrowed which means lower volatility.
- The RSI is above 50, no divergence.
- The MACD is giving bullish signal.
The bullish momentum may develop in case orange juice surpasses the last fractal high at 171. This level may serve the point of entry. The initial stop-loss may be placed below the two last fractal lows and the Parabolic signal at 161. Having opened the pending order we shall move the stop to the next fractal low following the Parabolic and Bollinger signals. Thus, we are changing the probable profit/loss ratio to the breakeven point. The most risk-averse traders may switch to the 4-hour chart after the trade and place there a stop-loss moving it in the direction of the trade. If the price meets the stop-loss level at 161 without reaching the order at 171, we recommend cancelling the position: the market sustains internal changes which were not taken into account.
Summary of technical analysis
| Position | Buy |
| Buy stop | above 171 |
| Stop loss | below 161 |
Explore our
Trading Conditions
- Spreads from 0.0 pip
- 30,000+ Trading Instruments
- Stop Out Level - Only 10%
Ready to Trade?
Open Account Note:
This overview has an informative and tutorial character and is published for free. All the data, included in the overview, are received from public sources, recognized as more or less reliable. Moreover, there is no guarantee that the indicated information is full and precise. Overviews are not updated. The whole information in each overview, including opinion, indicators, charts and anything else, is provided only for familiarization purposes and is not financial advice or а recommendation. The whole text and its any part, as well as the charts cannot be considered as an offer to make a deal with any asset. IFC Markets and its employees under any circumstances are not liable for any action taken by someone else during or after reading the overview.
