- Analytics
- Technical Analysis
US Dollar Index Technical Analysis - US Dollar Index Trading: 2016-11-01
Retracement ahead of presidential elections
US dollar index is correcting down amid higher political risks ahead of US presidential elections which are scheduled on November 8, 2016. Investors are concerned with the FBI investigation on Democratic candidate Hillary Clinton emails. Will US currency continue weakening?
In our opinion it is too early to determine to which consequences will lead the FBI’s probe into Clinton’s emails. There may be no consequences at all. But the US dollar index rose 5% since the late August and some investors could have decided to fix profits ahead of elections. This week will be full of economic data which may affect the US currency rate. ISM Manufacturing PMI for October and construction spending data for September will come out in US on Tuesday, the tentative outlook is positive for dollar. The next Fed meeting will take place on Wednesday, no interest rate hike is anticipated ahead of elections but investors may react on US Fed comments. Several economic indicators will come out on Thursday which may be weak. The important labour market report for October and trade balance for September will be released in US on Friday. Quite a modest increase in Non-farm Payrolls is anticipated which may weigh on US dollar rate.
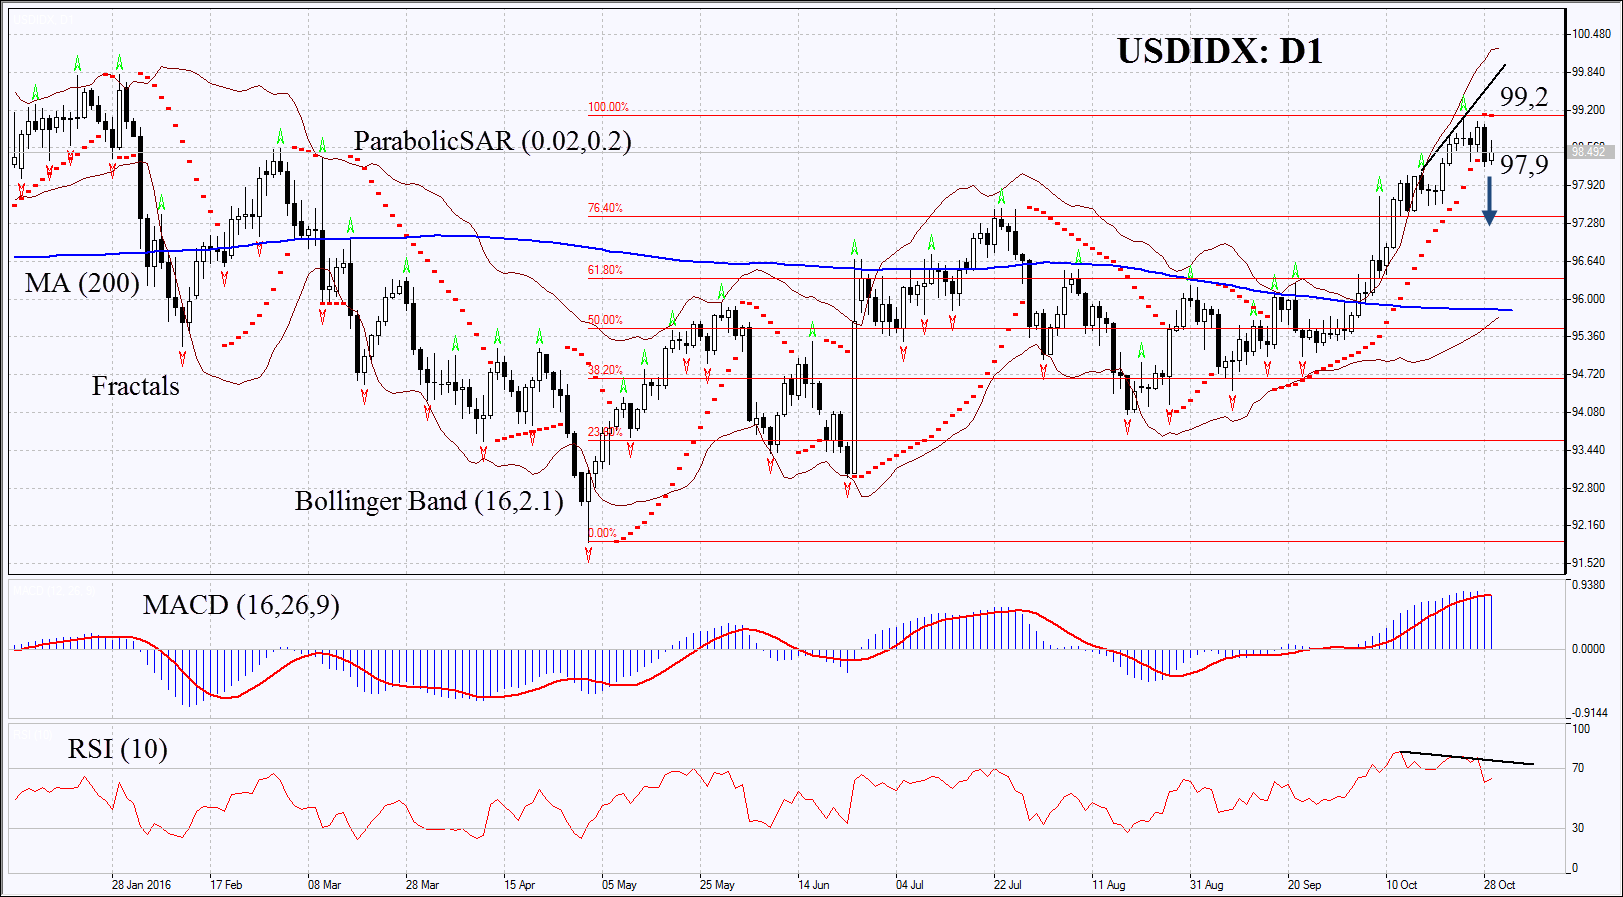
On the daily chart USDIDX: D1 is correcting down. Further decline is possible in case of higher political risks ahead of elections and in case of weak US economic indicators.
- Parabolic is giving bearish signals.
- Bollinger bands have widened a lot which means extremely high volatility.
- RSI is above 50. It has left the overbought zone having formed negative divergence.
- MACD is giving bullish signals.
The bearish momentum may develop in case US dollar index falls below the Friday low at 97.9. This level may serve the point of entry. The initial stop-loss may be placed above the Parabolic signal, the last fractal high and 9-month high at 99.2. Having opened the pending order we shall move the stop to the next fractal high following the Parabolic and Bollinger signals. Thus, we are changing the probable profit/loss ratio to the breakeven point. The most risk-averse traders may switch to the 4-hour chart after the trade and place there a stop-loss moving it in the direction of the trade. If the price meets the stop-loss level at 99.2 without reaching the order at 97.9, we recommend cancelling the position: the market sustains internal changes which were not taken into account.
Summary of technical analysis
| Position | Sell |
| Sell stop | below 97.9 |
| Stop loss | above 99.2 |
Explore our
Trading Conditions
- Spreads from 0.0 pip
- 30,000+ Trading Instruments
- Stop Out Level - Only 10%
Ready to Trade?
Open Account Note:
This overview has an informative and tutorial character and is published for free. All the data, included in the overview, are received from public sources, recognized as more or less reliable. Moreover, there is no guarantee that the indicated information is full and precise. Overviews are not updated. The whole information in each overview, including opinion, indicators, charts and anything else, is provided only for familiarization purposes and is not financial advice or а recommendation. The whole text and its any part, as well as the charts cannot be considered as an offer to make a deal with any asset. IFC Markets and its employees under any circumstances are not liable for any action taken by someone else during or after reading the overview.
