- Analytics
- Technical Analysis
US Dollar Index Technical Analysis - US Dollar Index Trading: 2019-10-14
The US dollar has suffered on a backdrop of lower global risks
Progress in US-China trade negotiations and Brexit conditions caused a weakening of the US dollar. Will the USDIDX index quotations continue falling?
The US dollar was previously viewed as a currency of refuge against the backdrop of global trade risks. Bloomberg said on Friday that negotiations between the US and China are very successful. US President Donald Trump said a deal with the PRC will not require Congressional approval. EU officials said they would continue to work with the UK to avoid a “rough” Brexit. Investors hope to sign an agreement before the country's exit from the EU, scheduled for October 31, 2019. This helped strengthen the euro and the pound and lower the USDIDX. An additional negative for the dollar is the expectation of a Fed rate cut at the next meeting on October 30.
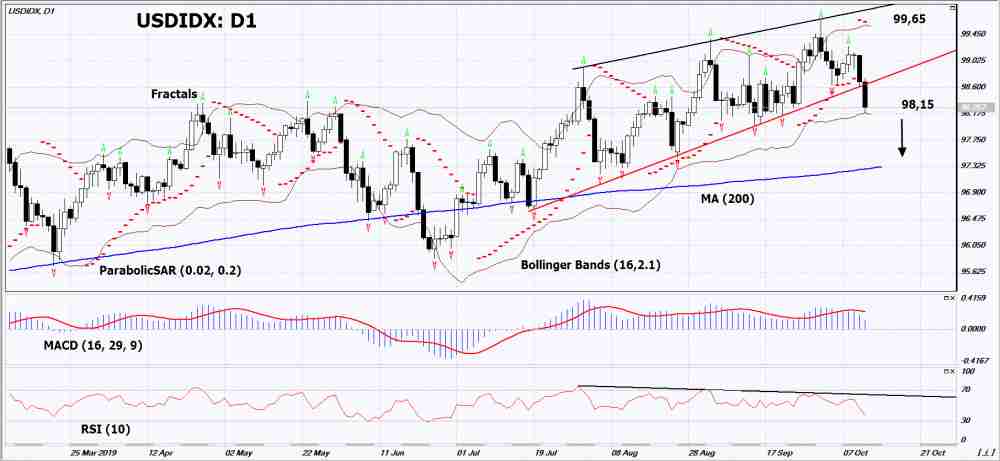
On the daily timeframe the USDIDX: D1 broke down the support line of the uptrend. Various technical analysis indicators formed a downtrend signal. Quotations reduction is possible in case of publication of negative data on the US economy.
- The Parabolic indicator shows a signal to decrease.
- The Bolinger bands widened, indicating high volatility. Both Bollinger Lines Slope Down.
- The RSI indicator is below the 50 mark. It has formed a double divergence to fall.
- The MACD indicator gives a bearish signal.
The bearish momentum may develop if USDIDX falls below its last low and the lower Bollinger line: 98.15. This level can be used as an entry point. The initial stop lose may be placed higher than the last upper fractal, the maximum since May 2017, the upper Bollinger line and the Parabolic signal: 99.65. After opening the pending order, the stop shall be moved following the Bollinger and Parabolic signals to the next fractal minimum. Thus, we are changing the potential profit/loss to the breakeven point. More risk-averse traders may switch to the 4-hour chart after the trade and place a stop loss moving it in the direction of the trade. If the price meets the stop level (99,65) without reaching the order (98,15), we recommend to cancel the order: the market sustains internal changes that were not taken into account.
Technical Analysis Summary
| Position | Sell |
| Sell stop | Below 98,15 |
| Stop loss | Above 99,65 |
Explore our
Trading Conditions
- Spreads from 0.0 pip
- 30,000+ Trading Instruments
- Stop Out Level - Only 10%
Ready to Trade?
Open Account Note:
This overview has an informative and tutorial character and is published for free. All the data, included in the overview, are received from public sources, recognized as more or less reliable. Moreover, there is no guarantee that the indicated information is full and precise. Overviews are not updated. The whole information in each overview, including opinion, indicators, charts and anything else, is provided only for familiarization purposes and is not financial advice or а recommendation. The whole text and its any part, as well as the charts cannot be considered as an offer to make a deal with any asset. IFC Markets and its employees under any circumstances are not liable for any action taken by someone else during or after reading the overview.
