- Analytics
- Technical Analysis
Gold Technical Analysis - Gold Trading: 2022-02-21
Gold Euro Technical Analysis Summary
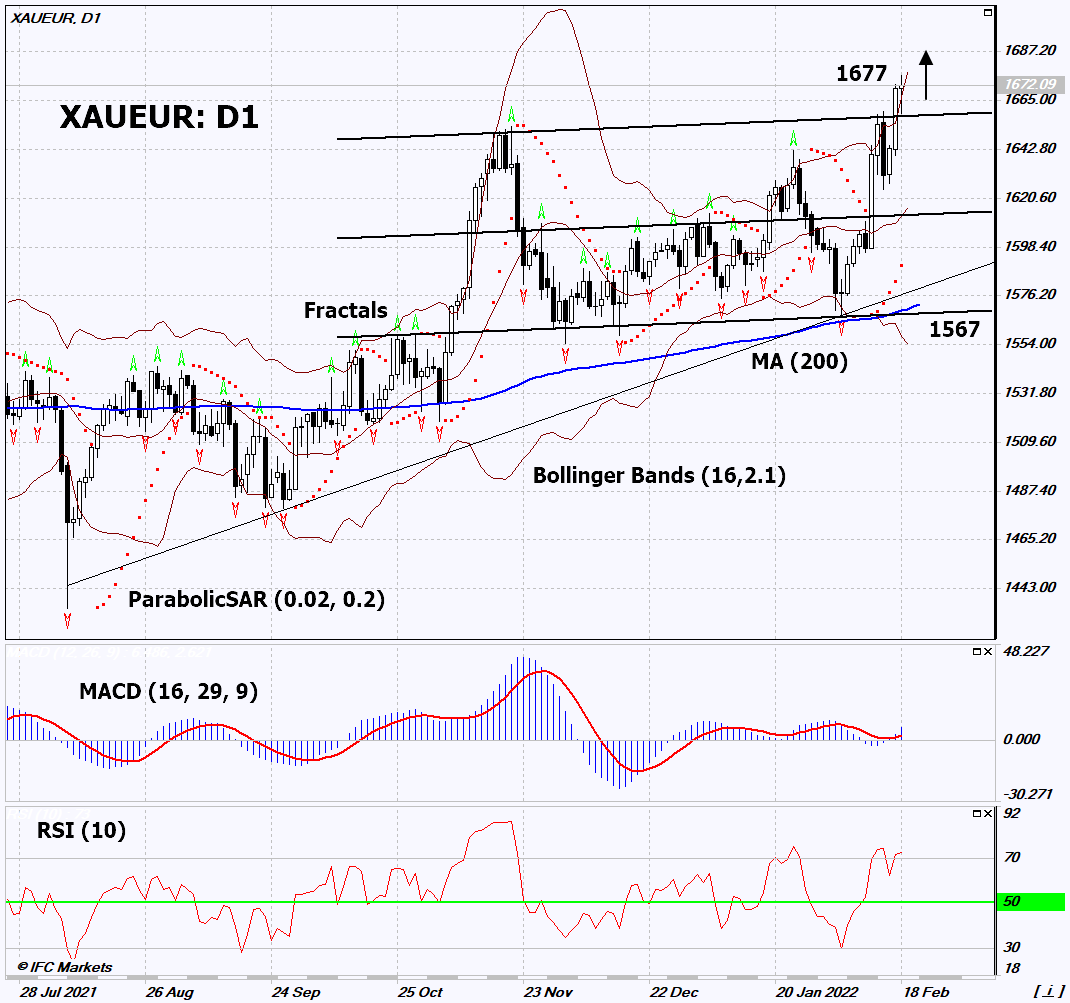
Above 1677
Buy Stop
Below 1567
Stop Loss
| Indicator | Signal |
| RSI | Neutral |
| MACD | Buy |
| MA(200) | Neutral |
| Fractals | Buy |
| Parabolic SAR | Buy |
| Bollinger Bands | Buy |
Gold Euro Chart Analysis
Gold Euro Technical Analysis
On the daily timeframe, XAUEUR: D1 broke through the upper limit of the rising channel. A number of technical analysis indicators formed signals for further growth. We do not rule out a bullish move if XAUEUR rises above the latest high (since August 2020) and the upper Bollinger band: 1677. This level can be used as an entry point. The initial risk limit is possible below the last lower fractal, the 200-day moving average line and the Parabolic signal: 1567. After opening a pending order, we move the stop following the Bollinger and Parabolic signals to the next fractal low. Thus, we change the potential profit/loss ratio in our favor. The most cautious traders after making a trade can switch to a four-hour chart and set a stop loss, moving it in the direction of movement. If the price overcomes the stop level (1567) without activating the order (1677), it is recommended to delete the order: there are internal changes in the market that were not taken into account.
Fundamental Analysis of Precious Metals - Gold Euro
Fed officials made their comments on the rate hike. Will the growth of XAUEUR quotes continue?
Cleveland Fed President Loretta Mester said that the Fed needs to raise rates and reduce its balance sheet faster than it was during the "Great Recession" (Great Depression in the 30s of the last century). St. Louis Fed President James Bullard was more open and suggested that the rate would need to be raised by 2% to slow inflation. This somewhat disappointed investors and supported the growth of precious metals quotes. The current Fed rate is 0.25%. The yield on the US 10-year Treasury is 1.93% per annum. Investors are worried that even if the Fed raises the rate by 2% before the end of this year, the yield of US government bonds may not exceed inflation. In January, consumer price growth was a record for 40 years and amounted to 7.5% y/y. US inflation data for February will be released on March 10, and the next Fed meeting will take place on March 16. According to the CME FedWatch forecast, the Fed's maximum rate hike this time could be only 0.5%. At the same time, inflation is expected to rise further in February to 7.6% y/y.
Explore our
Trading Conditions
- Spreads from 0.0 pip
- 30,000+ Trading Instruments
- Stop Out Level - Only 10%
Ready to Trade?
Open Account Note:
This overview has an informative and tutorial character and is published for free. All the data, included in the overview, are received from public sources, recognized as more or less reliable. Moreover, there is no guarantee that the indicated information is full and precise. Overviews are not updated. The whole information in each overview, including opinion, indicators, charts and anything else, is provided only for familiarization purposes and is not financial advice or а recommendation. The whole text and its any part, as well as the charts cannot be considered as an offer to make a deal with any asset. IFC Markets and its employees under any circumstances are not liable for any action taken by someone else during or after reading the overview.

