- Analytics
- Technical Analysis
Gold vs Oil Technical Analysis - Gold vs Oil Trading: 2017-12-18
Oil production increases in the US
Oil quotes may correct down amid the production growth in the US. Gold prices are increasing from a 5-month low. Will the XAUOIL quotes rise?
The International Energy Agency (IEA) raised the forecast for oil production increase in the US in 2018 from 790,000 to 870,000 barrels per day (bpd). OPEC expects the US production to grow by 1.05 mln bpd. The official forecast from the U.S. Energy Information Administration assumes an increase in the US oil production by 780 thousand bpd in the next year. Currently, 9.78 mln bpd are produced there. Increasing oil production may decrease its quotes. The US oil reserves have been declining for the fourth consecutive week and have reached 443 mln barrels. The IEA announced that oil reserves in all developed countries - the main oil consumers, fell by 40.3 mln barrels to 2.94 bln barrels in October 2017. This level is the lowest since July 2015 and by only 111 mln barrels higher than their average volume for the last 5 years. Previously, OPEC and independent producers announced that the oil production limitation will remain in force until the reserves of the developed countries are equal to the 5-year average volume. The annulment of the oil production limitation of the OPEC + agreement may increase the world market supply and decrease its quotes. Last week gold prices increased for the first time in 4 weeks. The Fed raised the rate, as expected, but the next rate hike is not expected soon. The US dollar index corrected down. Gold prices may continue to rise in case of increased political risks in the world.
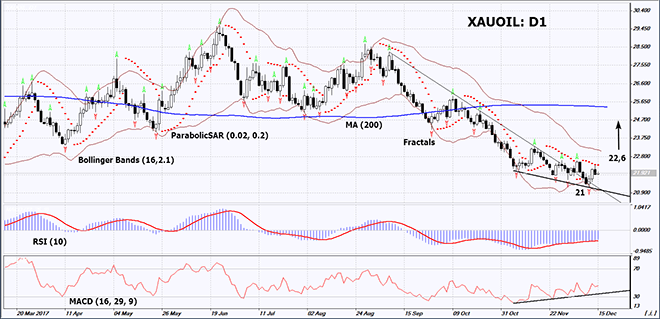
On the daily timeframe, XAUOIL: D1 is coming out of the downtrend. An upward reversal and continual increase in quotes are possible in case of the US oil production growth and accelerating political tensions in the world.
- The Parabolic indicator gives a bearish signal. It can be used as an additional resistance level, which needs to be overcome to open a Buy position.
- The Bollinger bands are narrowing, which means lower volatility.
- The RSI indicator is below 50. It has formed a positive divergence.
- The MACD indicator gives a bullish signal.
The bullish momentum may develop in case XAUOIL exceeds the two last fractal highs and the Parabolic signal at 22.6. This level may serve as an entry point. The initial stop loss may be placed below the last fractal low, the 11-month low and the lower Bollinger band at 21. After opening the pending order, we shall move the stop to the next fractal low following the Bollinger and Parabolic signals. Thus, we are changing the potential profit/loss to the breakeven point. More risk-averse traders may switch to the 4-hour chart after the trade and place there a stop loss moving it in the direction of the trade. If the price meets the stop level at 21without reaching the order at 22.6, we recommend cancelling the position: the market sustains internal changes that were not taken into account.
Summary of technical analysis
| Position | Buy |
| Buy stop | Above 22,6 |
| Stop loss | Below 21 |
Explore our
Trading Conditions
- Spreads from 0.0 pip
- 30,000+ Trading Instruments
- Stop Out Level - Only 10%
Ready to Trade?
Open Account Note:
This overview has an informative and tutorial character and is published for free. All the data, included in the overview, are received from public sources, recognized as more or less reliable. Moreover, there is no guarantee that the indicated information is full and precise. Overviews are not updated. The whole information in each overview, including opinion, indicators, charts and anything else, is provided only for familiarization purposes and is not financial advice or а recommendation. The whole text and its any part, as well as the charts cannot be considered as an offer to make a deal with any asset. IFC Markets and its employees under any circumstances are not liable for any action taken by someone else during or after reading the overview.
