- Analytics
- Technical Analysis
Gold vs Yuan Technical Analysis - Gold vs Yuan Trading: 2017-10-17
The 19th Communist Party Congress will start in China
In this review, we suggest considering the personal composite instrument (PCI) “Gold vs Yuan”. It increases when gold rises in price on the world market and the Chinese currency weakens. Is there a possibility for the XAUCNH prices to rise?
The value of gold again exceeded the psychological level of 1300 per ounce and shows a tendency for the further growth. Precious metals, on the whole, become more expensive against the background of increasing political risks around Iran and North Korea, as well as due to the publication of negative data on the state of the US economy. In its turn, the yuan demonstrates a slight weakening before the 19th Congress of the Chinese Communist Party (CCP), which will begin on October 18, 2017. Deputies will elect a new composition of the Politburo of the Central Committee and a number of other authorities. In addition, a number of important economic decisions will be made, and changes in the Charter of the CCP are also expected.
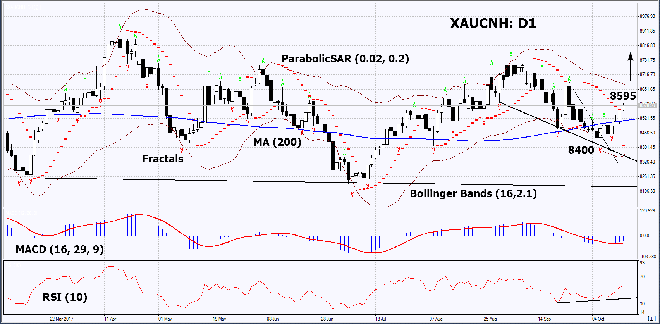
On the daily timeframe, XAUCNH: D1 has left the downtrend and is moving toward the upper boundary of the wide neutral range. It overcame the 200-day moving average line. The further price increase is possible in case of the aggravation of the political situation in the world, as well as weak economic data in the US and China.
- The Parabolic indicator gives a bullish signal.
- The Bollinger bands have narrowed, which means lower volatility.
- The RSI indicator is above 50. It has formed a positive divergence.
- The MACD indicator gives a bullish signal.
The bullish momentum may develop in case XAUCNH exceeds its last high at 8595. This level may serve as an entry point. The initial stop loss may be placed below the two last fractal lows and the Parabolic signal at 8400. After opening the pending order, we shall move the stop to the next fractal low following the Bollinger and Parabolic signals. Thus, we are changing the potential profit/loss to the breakeven point. More risk-averse traders may switch to the 4-hour chart after the trade and place there a stop loss moving it in the direction of the trade. If the price meets the stop level at 8400 without reaching the order at 8595, we recommend cancelling the position: the market sustains internal changes that were not taken into account.
Summary of technical analysis
| Position | Buy |
| Buy stop | Above 8595 |
| Stop loss | Below 8400 |
- Get Certificate

Note:
This overview has an informative and tutorial character and is published for free. All the data, included in the overview, are received from public sources, recognized as more or less reliable. Moreover, there is no guarantee that the indicated information is full and precise. Overviews are not updated. The whole information in each overview, including opinion, indicators, charts and anything else, is provided only for familiarization purposes and is not financial advice or а recommendation. The whole text and its any part, as well as the charts cannot be considered as an offer to make a deal with any asset. IFC Markets and its employees under any circumstances are not liable for any action taken by someone else during or after reading the overview.
