- Analytics
- Technical Analysis
Platinum Technical Analysis - Platinum Trading: 2017-03-27
Weaker US dollar supports demand for precious metals
Palladium prices skyrocketed to 2-year high. The metal is in demand for both investment and industrial purposes. Will platinum follow palladium which is also actively used for manufacturing and investments?
In general the demand for all precious metals is supported amid investors’ worries that the implementation of new economic program of US president Donald Trump may face severe difficulties and be slow in coming. Such risks may weaken US dollar and make investments in gold more appealing. Palladium advanced 20% since the start of the year, silver added 11.3% while gold gained 8.7%. Platinum rose by 7%. Meanwhile, according to the China's General Administration of Customs, import of palladium to China slumped in January-February 2017 by 48% to 3 tonnes compared to the same period of 2016. Imports of platinum fell less – by 28.5% to 9.9 tonnes. Previously World Platinum Investment Council said it was going to establish the platinum ETF in China. About 60% of global platinum production is used for industrial purposes. For palladium the rate is above 80%.
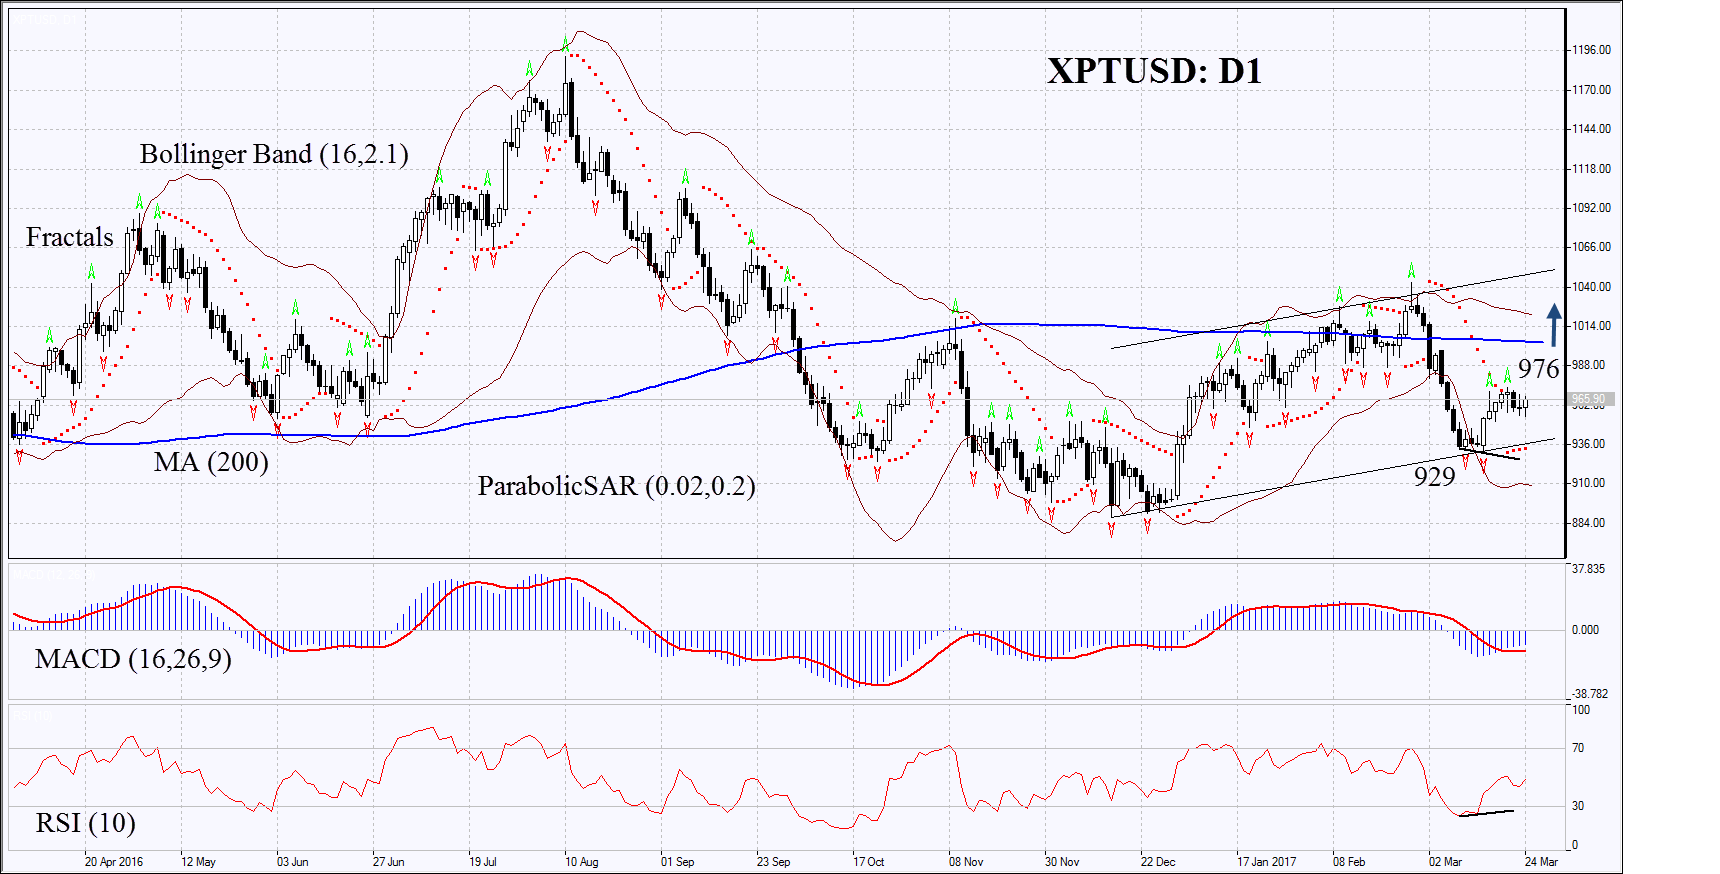
On the daily chart XPTUSD: D1 shows tendency to rise within the uptrend. The further increase is possible in case of higher global demand, in China among others, and in case US dollar continues weakening.
- The Parabolic indicator gives bullish signal.
- The Bollinger bands have widened a lot which means high volatility.
- The RSI is below 50. It has formed slight positive divergence.
- The MACD gives bullish signal.
The bullish momentum may develop in case XPTUSD surpasses the two last fractal highs at 976. This level may serve the point of entry. The initial stop-loss may be placed below the Parabolic signal and the last fractal low at 928. Having opened the pending order we shall move the stop to the next fractal low following the Parabolic and Bollinger signals. Thus, we are changing the probable profit/loss ratio to the breakeven point. The most risk-averse traders may switch to the 4-hour chart after the trade and place there a stop-loss moving it in the direction of the trade. If the price meets the stop-loss level at 929 without reaching the order at 976, we recommend cancelling the position: the market sustains internal changes which were not taken into account.
Summary of technical analysis
| Position | Buy |
| Buy stop | above 976 |
| Stop loss | below 929 |
Explore our
Trading Conditions
- Spreads from 0.0 pip
- 30,000+ Trading Instruments
- Stop Out Level - Only 10%
Ready to Trade?
Open Account Note:
This overview has an informative and tutorial character and is published for free. All the data, included in the overview, are received from public sources, recognized as more or less reliable. Moreover, there is no guarantee that the indicated information is full and precise. Overviews are not updated. The whole information in each overview, including opinion, indicators, charts and anything else, is provided only for familiarization purposes and is not financial advice or а recommendation. The whole text and its any part, as well as the charts cannot be considered as an offer to make a deal with any asset. IFC Markets and its employees under any circumstances are not liable for any action taken by someone else during or after reading the overview.
