- تحليلات
- التحليل الفني للسوق
نفط BRENT أمام الروبل الروسي التحليل الفني - نفط BRENT أمام الروبل الروسي التداول: 2021-03-23
نفط BRENT أمام الروبل الروسي ملخص التحليل الفني
أقل من 5330
Sell Stop
أعلى من 4750
Stop Loss
| مؤشر | الإشارة |
| RSI | بيع |
| MACD | بيع |
| MA(200) | محايد |
| Fractals | محايد |
| Parabolic SAR | بيع |
| Bollinger Bands | محايد |
نفط BRENT أمام الروبل الروسي تحليل الرسم البياني
نفط BRENT أمام الروبل الروسي التحليل الفني
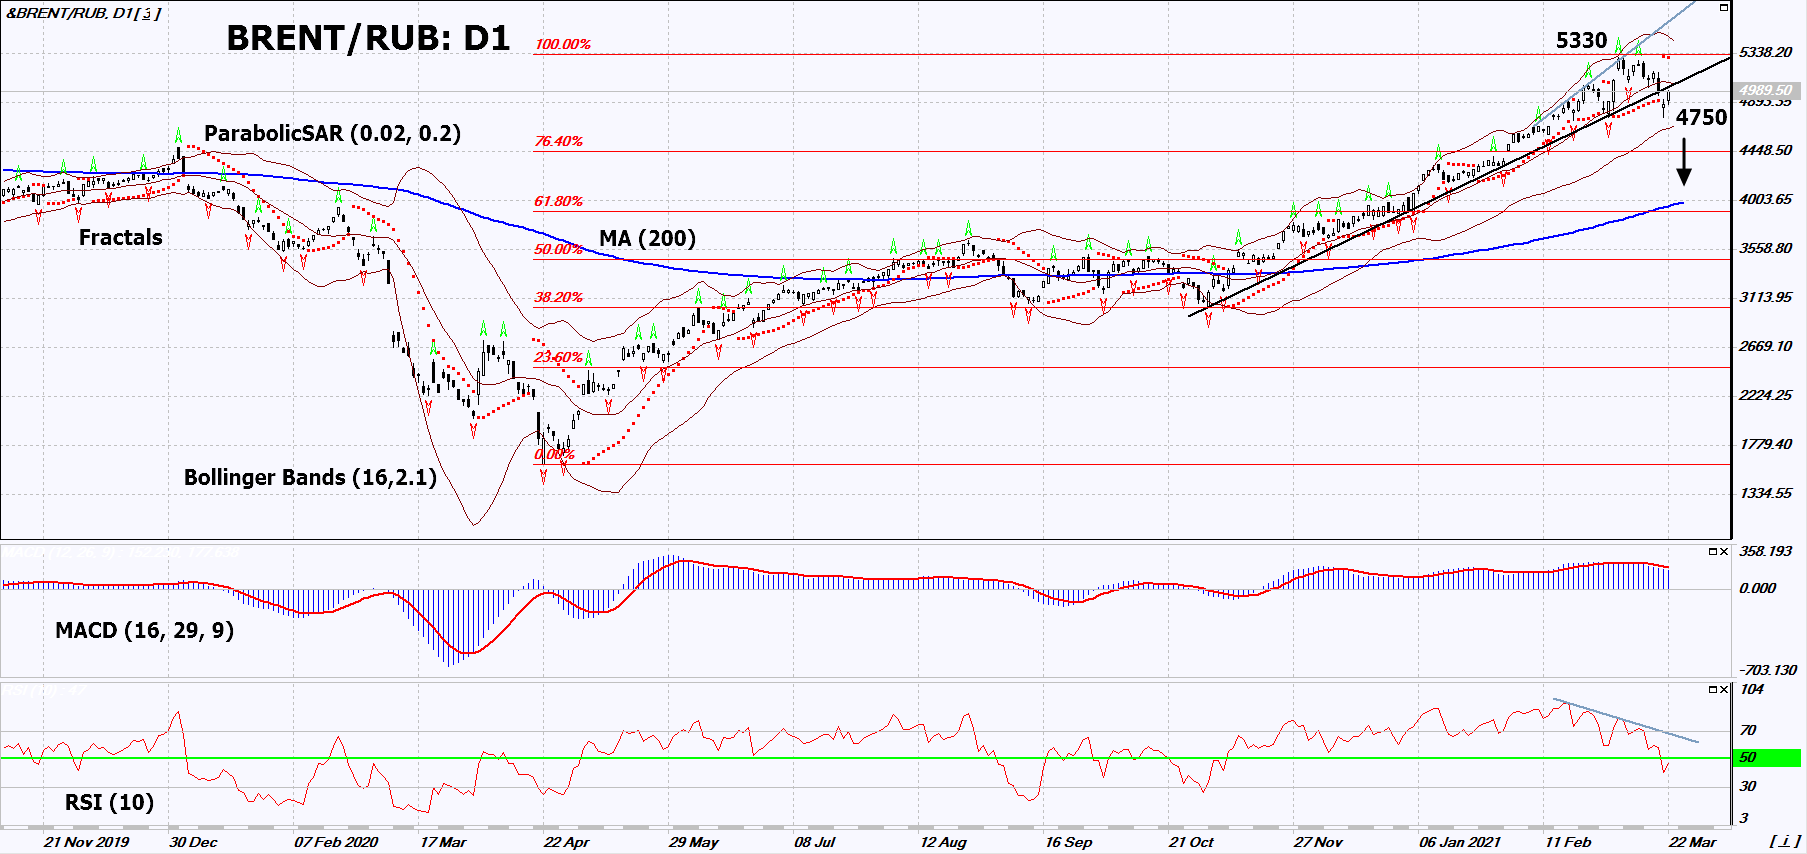
On the daily timeframe, BRENT/RUB: D1 breached down the uptrend support line. A number of technical analysis indicators formed signals for a further drop. We do not exclude a bearish move if BRENT/RUB falls below the last low: 4750. This level can be used as an entry point. We can place a stop loss above the high since October 2018 and the Parabolic signal: 5330. After opening the pending order, we can move the stop loss following the Bollinger and Parabolic signals to the next fractal maximum. Thus, we change the potential profit/loss ratio in our favor. After the transaction, the most risk-averse traders can switch to the four-hour chart and set a stop loss, moving it in the direction of the bias. If the price meets the stop loss (5330) without activating the order (4750), it is recommended to delete the order: the market sustains internal changes that have not been taken into account.
التحليل الأساسي لـ PCI - نفط BRENT أمام الروبل الروسي
In this review, we suggest considering the "BRENT vs the Ruble" personal composite instrument (PCI). It reflects the dynamics of changes in the cost of a Brent barrel against the Russian currency. Will the BRENT/RUB quotes go down?
PCI declines when oil gets cheaper and the ruble strengthens against the US dollar and, on the contrary, it grows when oil prices rise while the ruble weakens. By contrast, the Russian currency tends to strengthen at high oil prices and weaken at low oil prices. Because of this, BRENT/RUB quotes usually fluctuate around their long-term, 200-day moving average. Now they have deviated noticeably from it. In other words, the ruble remains weak against the US dollar despite strong growth in world oil prices. Recall that the all-time high of this PCI was at 5909 in October 2018. Now it is below this level, but at the same time, it breached down the upward trend line. PCI fluctuations around the moving average are due to the Russian export structure. According to Russian Customs statistics, the share of fuel and energy products exported from Russia to non-CIS countries in 2020 amounted to 53.8% (66.9% in January-December 2019). The slight decrease is due to the drop in world oil prices because of the coronavirus pandemic.
استكشف
شروط التداول لدينا
- فروق الأسعار من 0.0 نقطة
- أكثر من 30,000 أداة تداول
- مستوى التوقف (الستوب أوت) - 10% فقط
هل أنت مستعد للتداول؟
فتح حساب :تنبيه
يحمل هذا الموجز طابعاً إعلامياً و تعليمياً و تنشر بالمجان . تأتي معظم البيانات المدرجة في الموجز من المصادر العامة معترفة أكثر و أقل موثوقية . مع ذلك ، لا يوجد تأكيد على أن المعلومات المشارة إليها كاملة و دقيقة . لا يتم تحديث الموجز . معظم المعلومات في كل موجز ، تتضمن الرأي و المؤشرات و الرسوم البيانية و أي شيئ اخر وتقدم فقط لأغراض التعريف وليس المشورة المالية أو توصية . لا يمكن اعتبار النص باكماله أو أي جزء منه و أيضاً الرسوم البيانية كعرض لقيام بصفقة بأي اداة . آي إف سي ماركيتس وموظفيها ليست مسؤولة تحت أي ظرف من الظروف عن أي إجراء يتم اتخاذه من قبل شخص آخر أثناء أو بعد قراءة نظرة عامة .


