- تحليلات
- أكثر الرابحين / الخاسرين
Top Gainers and Losers: Russian ruble and Japanese yen
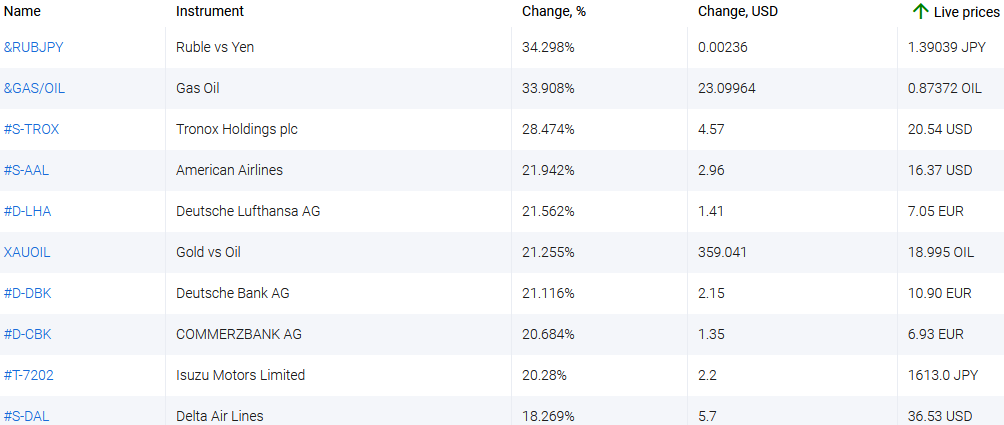
 Top Gainers - global market
Over the past 7 days, the US dollar index has fallen. Investors found it insufficient to increase the Fed's rate from 0.25% to 0.5% at a meeting on March 16. Since the US inflation in February reached a maximum in 40 years and amounted to 7.9% y/y. The Russian ruble has strengthened thanks to Russia's counter-sanctions against Western countries. In particular, the Russian authorities introduced the mandatory sale of 80% of exporters' foreign exchange earnings, raised the rate to 20%, and also limited the circulation of cash currency in the country. The Canadian, New Zealand and Australian dollars strengthened against the backdrop of high world commodity prices. The Japanese yen weakened after Bank of Japan Governor Haruhiko Kuroda expressed doubt that inflation will reach the target level of 2% y/y despite the rise in oil and other commodity prices. Recall that the Japan Consumer Price Index for February will be published on the morning of March 18 and on the same day a meeting of the Bank of Japan will be held. According to forecasts, inflation will be 0.3% y/y. Investors believe that such low inflation will not allow Bank of Japan to raise the rate (-0.1%) for a long time to come.
1.&RUBJPY, +34,3% – personal composite instrument: Russian ruble versus Japanese yen
2. &GAS/OIL, +33,9% – personal composite instrument: US natural gas versus WTI oil
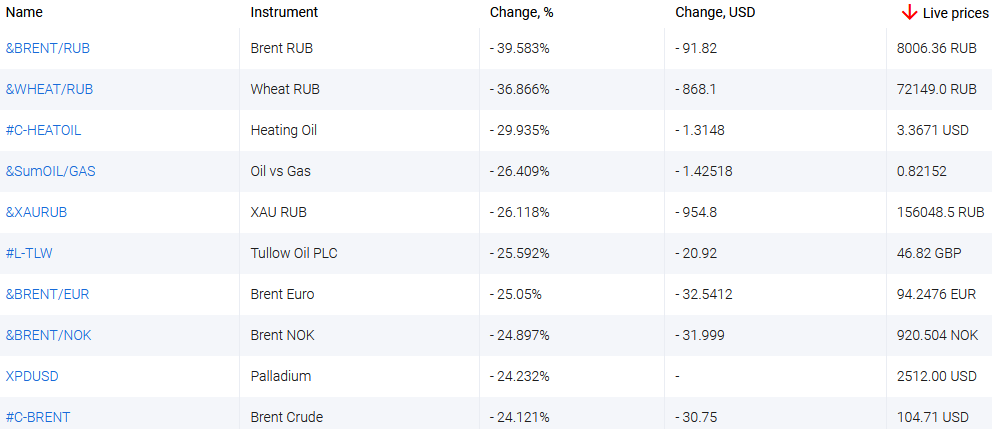
 Top Losers - global market
1. &BRENT/RUB – personal composite instrument: Brent oil versus Russian ruble
2. &WHEAT/RUB – personal composite instrument: wheat versus Russian ruble
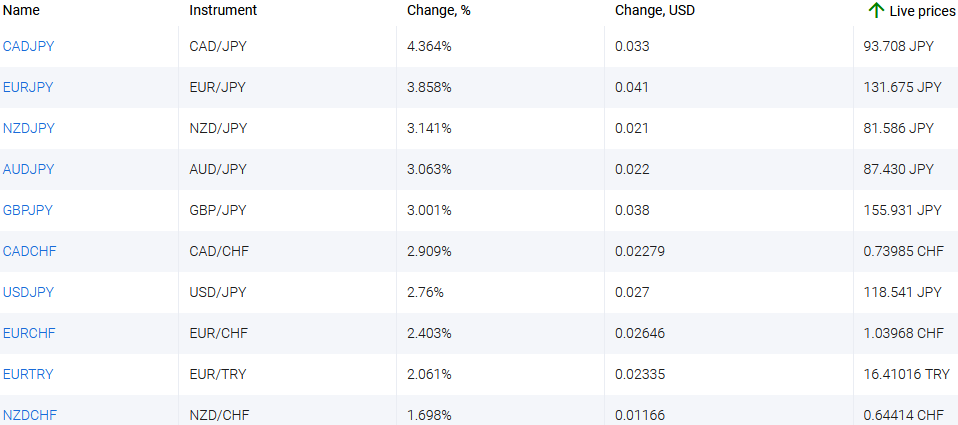
Top Gainers - foreign exchange market (Forex)
1. CADJPY, EURJPY - the increase of these charts means the strengthening of the Canadian dollar and euro against the Japanese yen.
2. NZDJPY, AUDJPY - the increase of these charts means the weakening of the Japanese yen against the New Zealand and Australian dollars.
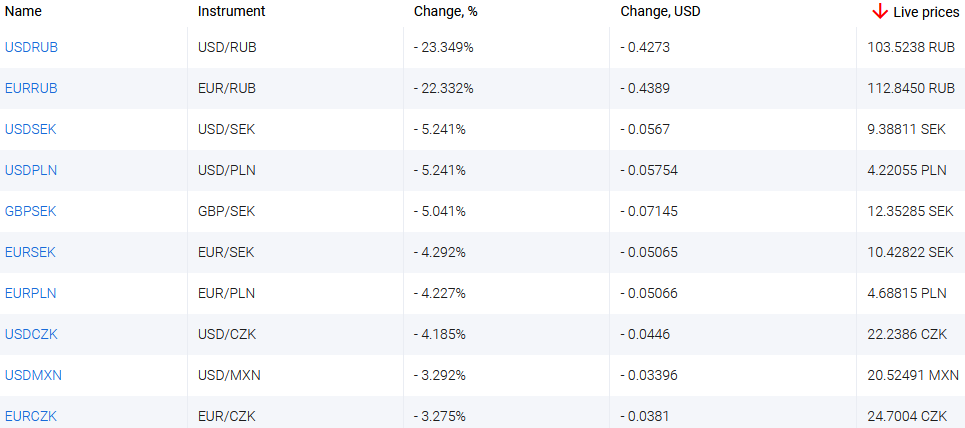
Top Losers - foreign exchange market (Forex)
1. EURRUB, USDRUB - the decline of these charts means the weakening of the euro and the US dollar against the Russian ruble.
2. USDSEK, USDPLN - the decline of these charts means the strengthening of the US dollar against the Swedish krona and the Polish zloty.
أداة حصرية جديدة للتحليل
ا يوجد نطاق زمني محدد – من يوم إلى سنة
أي مجموعة تداول – فوركس ، أسهم ، مؤشرات إلى أخره..
:تنبيه
يحمل هذا الموجز طابعاً إعلامياً و تعليمياً و تنشر بالمجان . تأتي معظم البيانات المدرجة في الموجز من المصادر العامة معترفة أكثر و أقل موثوقية . مع ذلك ، لا يوجد تأكيد على أن المعلومات المشارة إليها كاملة و دقيقة . لا يتم تحديث الموجز . معظم المعلومات في كل موجز ، تتضمن الرأي و المؤشرات و الرسوم البيانية و أي شيئ اخر وتقدم فقط لأغراض التعريف وليس المشورة المالية أو توصية . لا يمكن اعتبار النص باكماله أو أي جزء منه و أيضاً الرسوم البيانية كعرض لقيام بصفقة بأي اداة . آي إف سي ماركيتس وموظفيها ليست مسؤولة تحت أي ظرف من الظروف عن أي إجراء يتم اتخاذه من قبل شخص آخر أثناء أو بعد قراءة نظرة عامة .
- الحصول على الشهادة


الرابحون والخاسرون السابقون
Over the past 7 days, the American dollar has remained almost unchanged. According to the CME FedWatch tool, there is an 89% probability of the U.S. Federal Reserve raising interest rates at the meeting on July 26th. The Swiss franc has strengthened due to positive economic indicators such as Credit...
Over the past 7 days, the US dollar index has declined. As expected, the Federal Reserve (Fed) maintained its interest rate at 5.25% during the meeting on June 14. Now, investors are monitoring economic statistics and trying to forecast the change in the Fed's rate at the next meeting on July 26. The...
Over the past 7 days, the US dollar index has remained largely unchanged. It has been trading in a narrow range of 103.2-104.4 points for the 4th week in a row. Investors are awaiting the outcome of the Federal Reserve meeting on June 14. Tesla shares have risen due to the opening of new gigafactories...