- تحليلات
- التحليل الفني للسوق
مؤشر الدولار الأمريكي التحليل الفني - مؤشر الدولار الأمريكي التداول: 2021-03-01
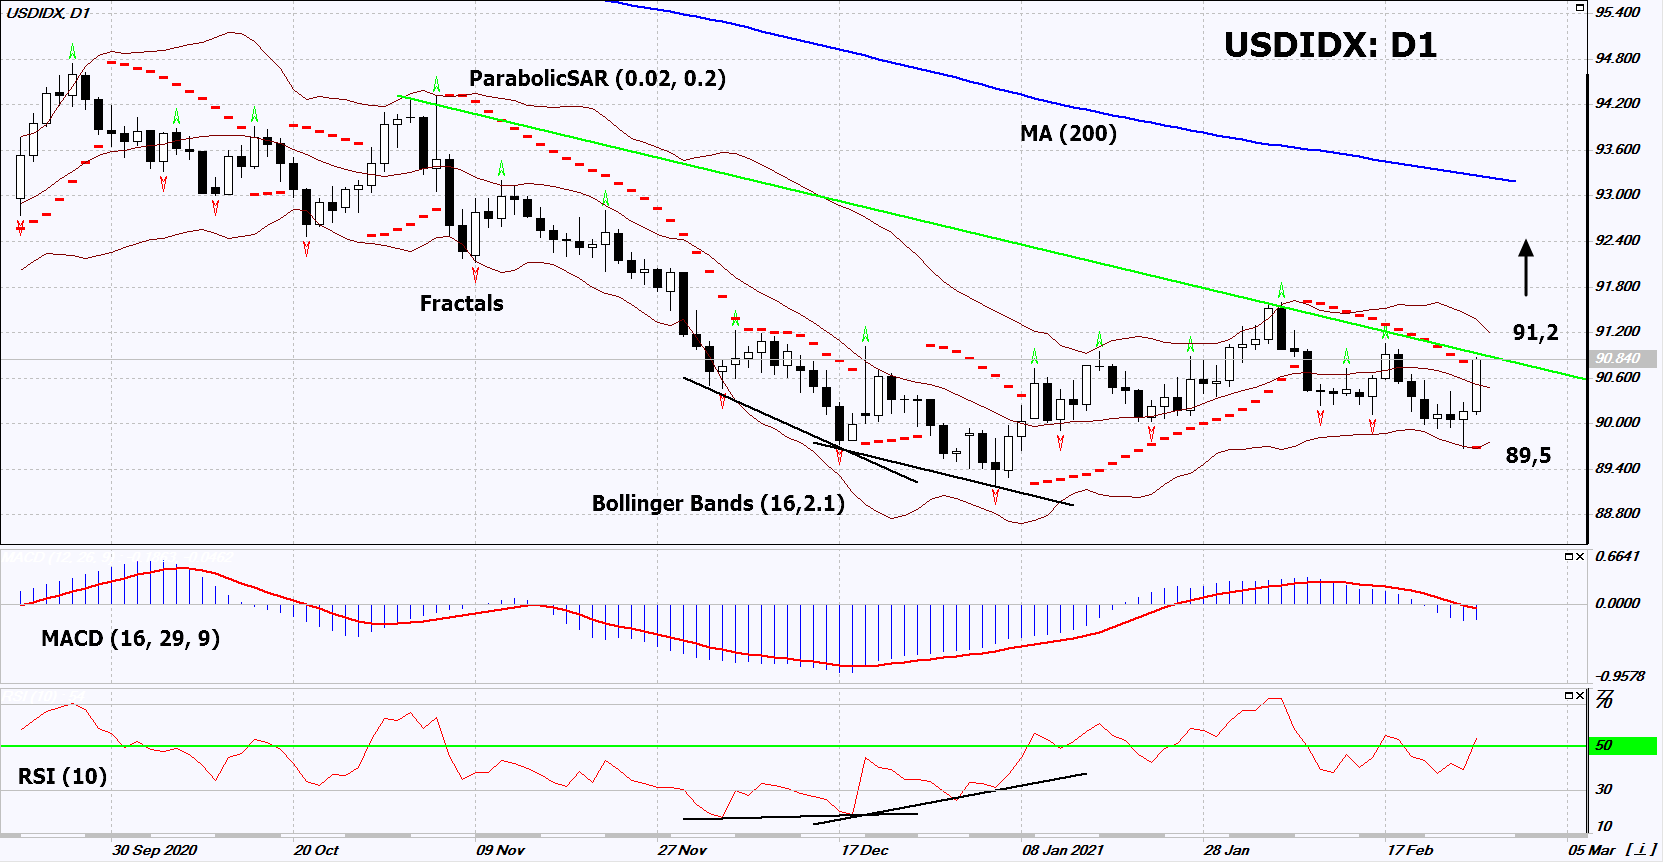
مؤشر الدولار الأمريكي ملخص التحليل الفني
أعلى من 91,2
Buy Stop
أقل من 89,5
Stop Loss
| مؤشر | الإشارة |
| RSI | شراء |
| MACD | بيع |
| MA(200) | محايد |
| Fractals | محايد |
| Parabolic SAR | شراء |
| Bollinger Bands | محايد |
مؤشر الدولار الأمريكي تحليل الرسم البياني
مؤشر الدولار الأمريكي التحليل الفني
On the daily timeframe, USDIDX: D1 approached the resistance line of the long-term descending channel. It must be broken upward before opening a position. A number of technical analysis indicators formed signals for further growth. We do not rule out a bullish movement if USDIDX: D1 rises above the upper Bollinger band and the last upper fractal: 91.2. This level can be used as an entry point. We can place a stop loss below the Parabolic signal and the lower Bollinger band: 89.5. After opening a pending order, we can move the stop loss to the next fractal low following the Bollinger and Parabolic signals. Thus, we change the potential profit/loss ratio in our favor. After the transaction, the most risk-averse traders can switch to the four-hour chart and set a stop loss, moving it in the direction of the bias. If the price meets the stop loss (89.5) without activating the order (91.2), it is recommended to delete the order: the market sustains internal changes that have not been taken into account.
التحليل الأساسي لـ المؤشرات - مؤشر الدولار الأمريكي
The US Treasury yield rose markedly. Will the USDIDX quotes grow ?
The 10-year U.S. Treasury note yield approached 1.6% per annum, whereas at the beginning of this year it was only 0.9%. Rising yields may increase demand for the dollars needed to purchase bonds. Some investors believe that the Fed will start tightening its monetary policy and raising rates much earlier than previously thought. This may be due to the active recovery of the American economy after the Covid-19 pandemic. Most of the economic indicators published last week exceeded their forecasts. The key event of this week is the release of the Non-Farm Payrolls on Friday.
استكشف
شروط التداول لدينا
- فروق الأسعار من 0.0 نقطة
- أكثر من 30,000 أداة تداول
- مستوى التوقف (الستوب أوت) - 10% فقط
هل أنت مستعد للتداول؟
فتح حساب :تنبيه
يحمل هذا الموجز طابعاً إعلامياً و تعليمياً و تنشر بالمجان . تأتي معظم البيانات المدرجة في الموجز من المصادر العامة معترفة أكثر و أقل موثوقية . مع ذلك ، لا يوجد تأكيد على أن المعلومات المشارة إليها كاملة و دقيقة . لا يتم تحديث الموجز . معظم المعلومات في كل موجز ، تتضمن الرأي و المؤشرات و الرسوم البيانية و أي شيئ اخر وتقدم فقط لأغراض التعريف وليس المشورة المالية أو توصية . لا يمكن اعتبار النص باكماله أو أي جزء منه و أيضاً الرسوم البيانية كعرض لقيام بصفقة بأي اداة . آي إف سي ماركيتس وموظفيها ليست مسؤولة تحت أي ظرف من الظروف عن أي إجراء يتم اتخاذه من قبل شخص آخر أثناء أو بعد قراءة نظرة عامة .

