- تحليلات
- التحليل الفني للسوق
الذهب التحليل الفني - الذهب التداول: 2025-06-24
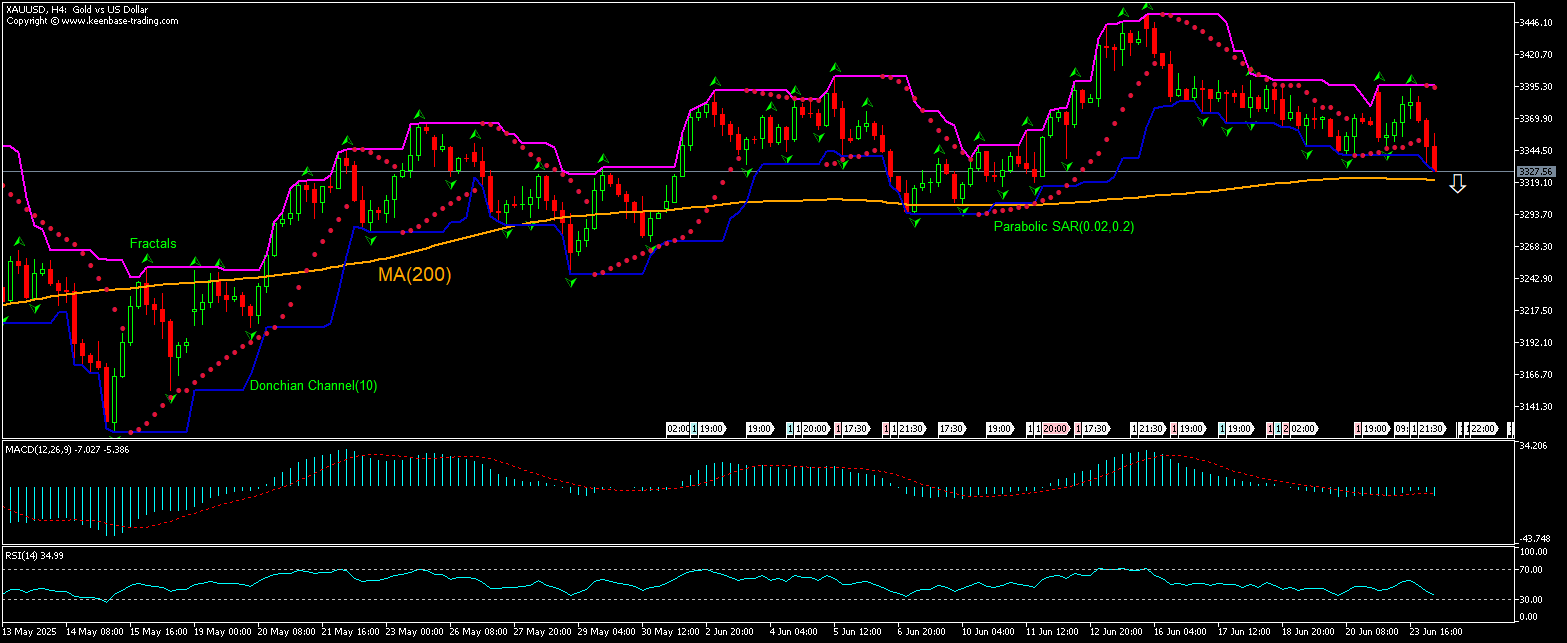
الذهب ملخص التحليل الفني
أقل من 3325.23
Sell Stop
أعلى من 3391.78
Stop Loss
| مؤشر | الإشارة |
| RSI | محايد |
| MACD | بيع |
| Donchian Channel | بيع |
| MA(200) | شراء |
| Fractals | محايد |
| Parabolic SAR | بيع |
الذهب تحليل الرسم البياني
الذهب التحليل الفني
The technical analysis of XAUUSD price on the 1-hour timeframe shows XAUUSD,H1 is testing the 200-period moving average MA(200) as it is retracing down after hitting 2-week high eight days ago. We believe the bearish momentum will continue after the price breaches below the lower Donchian boundary at 3325.23. This level can be used as an entry point for placing a pending order to sell. The stop loss can be placed above 3391.78. After placing the pending order the stop loss is to be moved every day to the next fractal high indicator, following Parabolic signals. Thus, we are changing the expected profit/loss ratio to the breakeven point. If the price meets the stop-loss level (3391.78) without reaching the order (3325.23) we recommend cancelling the order: the market sustains internal changes which were not taken into account.
التحليل الأساسي لـ المعادن الثمينة - الذهب
Gold prices are retreating after Iran’s missile attack on a US airbase in Qatar. Will the XAUUSD retreating continue?
Iran responded with a missile attack on a US airbase in Qatar after the US conducted aerial attack on Iran’s nuclear facilities. Usually in periods of heightened geopolitical uncertainty demand for safe haven precious metal rises as investors increase their holdings of gold for the ability of the safe haven asset to preserve its value. Currently though prices have been struggling to hold above $3,400 an ounce as it trades in a sideways pattern. However, major investment banks remain bullish on the safe haven precious metal. UBS particularly remains bullish on gold, maintaining its upside target of $3,800 an ounce. Banks’ bullish sentiment for gold is an upside risk for XAUUSD price.
استكشف
شروط التداول لدينا
- فروق الأسعار من 0.0 نقطة
- أكثر من 30,000 أداة تداول
- التنفيذ الفوري
هل أنت مستعد للتداول؟
فتح حساب :تنبيه
يحمل هذا الموجز طابعاً إعلامياً و تعليمياً و تنشر بالمجان . تأتي معظم البيانات المدرجة في الموجز من المصادر العامة معترفة أكثر و أقل موثوقية . مع ذلك ، لا يوجد تأكيد على أن المعلومات المشارة إليها كاملة و دقيقة . لا يتم تحديث الموجز . معظم المعلومات في كل موجز ، تتضمن الرأي و المؤشرات و الرسوم البيانية و أي شيئ اخر وتقدم فقط لأغراض التعريف وليس المشورة المالية أو توصية . لا يمكن اعتبار النص باكماله أو أي جزء منه و أيضاً الرسوم البيانية كعرض لقيام بصفقة بأي اداة . آي إف سي ماركيتس وموظفيها ليست مسؤولة تحت أي ظرف من الظروف عن أي إجراء يتم اتخاذه من قبل شخص آخر أثناء أو بعد قراءة نظرة عامة .

