- Analytics
- Market Overview
War, Oil and Fed: Markets This Week - 16.3.2026
BTCUSD Technical Analysis - BTCUSD Forecast
BTCUSD Technical Analysis - BTCUSD Forecast
Live Technical Analysis with instant forecast using most popular indicators and oscillators.
Try Now
Todays’ Market Summary
- The U.S. Dollar Index has eased slightly to the 100.31 area
- Global equities have shown surprising resilience
- Since the U.S. and Israel launched joint air strikes on Iran
- Gold price during Iran war has been unexpectedly choppy
Top daily news
U.S.Israeli military aggression against Iran entered its third week. FOMC meeting (March 17–18) with its updated Summary of Economic Projections (dot plot) will be the most closely watched event: the first meeting where the Fed must formally incorporate the Iran war's effects on inflation and growth into its forward guidance. Markets currently assign a 92%+ probability of a rate hold at 3.50% - 3.75%, per CME FedWatch, but the press conference on March 18 will set the tone for the rest of the year.
Trump's 15% blanket global tariff remains in place, keeping supply chain volatility elevated. Meanwhile, Jerome Powell's term as Fed chair expires May 23, 2026 with Kevin Warsh considered to succeed him.
- FOMC Meeting (March 17–18): Rate decision plus dot plot, first post-Iran war projections
- Bank of England & ECB policy meetings, Super Week for central banks
- U.S. energy data (EIA crude inventories) - closely watched amid Strait of Hormuz closure
- Any signs of ceasefire or Strait reopening will move all markets
Forex news
The U.S. Dollar Index has eased slightly to the 100.31 area as reports emerge of a possible U.S. led coalition to escort ships through the Strait of Hormuz, reducing immediate safe haven demand. Current Dollar Index strength is driven by 'fear,' temporarily decoupling the dollar from standard interest rate differentials.
- EURUSD Bearish / Cautious - Trading near 1.1439, testing year-to-date lows. Europe's energy dependence is weighing heavily on Eurozone growth. Resistance at 1.1550. ECB meeting this week.
- GBPUSD Neutral / Slight Bearish - Trading near 1.337 - 1.324 range. BoE's cautious rate path provides relative sterling support vs EUR. Downside bias while energy shock persists.
- USDJPY Bearish JPY (Cautious) - testing major resistance near 159.39. Yen reclaiming safe-haven status; BoJ speculation and geopolitical hedging pressure the pair lower. Support: 157.70.
Stock Market news
Global equities have shown surprising resilience, though not without volatility.
- S&P 500 is roughly flat (~6,880) since war began. Wells Fargo: median +0.4% return two weeks after geopolitical events since WWII. Carson Group: Buy-the-dip after initial drawdown.
- Nasdaq down ~0.5–2% since Feb 28. AI-driven gains facing valuation fatigue. Mega cap tech (NVIDIA, Microsoft) are buy the dip targets for institutional investors.
- Dow Jones is down ~1% since conflict began. Rotation into defense and value stocks underway. Energy companies (Exxon, Chevron) rallying sharply on oil price surge.
- Nikkei 225 dropped 3.06% on March 3, among the worst-hit globally. Yen safe-haven strength is weighing on export heavy Japanese stocks. BoJ policy uncertainty adds to volatility.
Commodity Market news
Since the U.S. and Israel launched joint air strikes on Iran on February 28 , Brent crude has surged from roughly $73 to briefly touching $120 - 65% spike in under two weeks, before settling near $103 at Friday's close.
WTI passed $100 and is trading around $102. The IEA reports that global oil supply has plunged by an estimated 8 mb/d in March, driven by the near-complete shutdown of tanker traffic through the Strait of Hormuz, which normally carries about 20% of global crude supply.
Gold Market News
| Gold USD | --- | --- | --- |
Gold price during Iran war has been unexpectedly choppy. It surged above $5,400 immediately following the February 28 strikes (+2% on the first trading day), but has since pulled back to approximately $5,170 - $5,240 down roughly 2 - 3% from pre war levels. This underperformance relative to Bitcoin has surprised some analysts, though the longer term structural bull case remains intact.
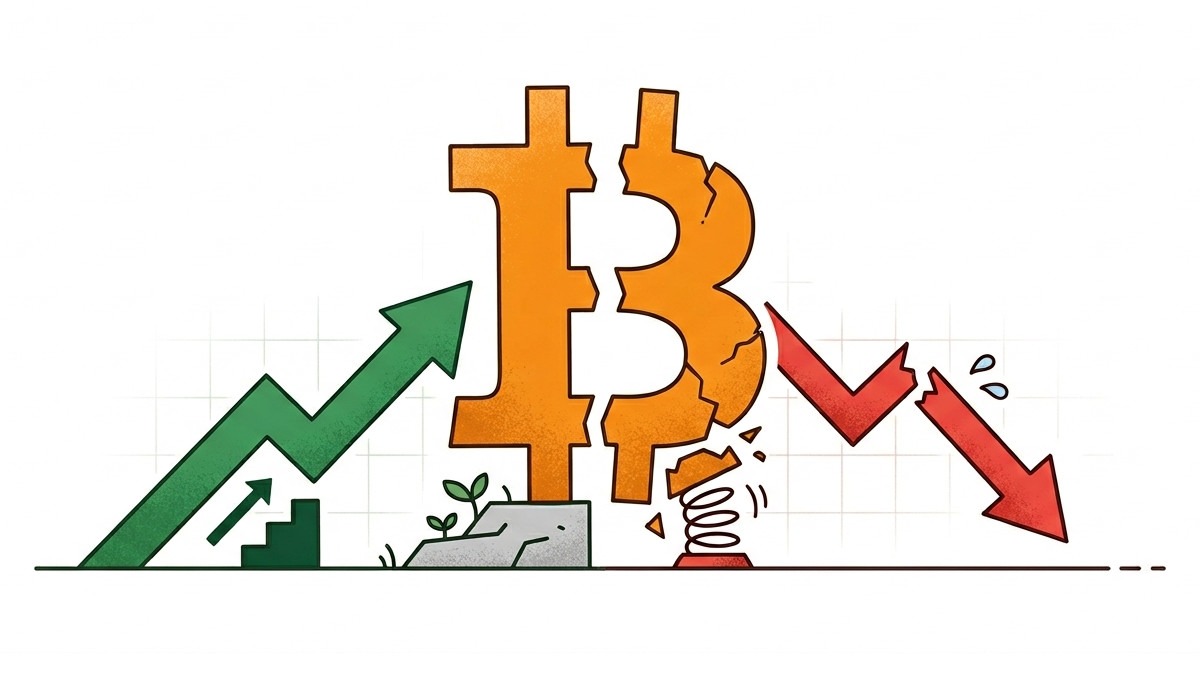
Crypto
| Bitcoin | --- | --- | --- |
| Ethereum - Dollar USA | --- | --- | --- |
Bitcoin, after dropping 8.5% on February 28, then has rallied approximately 7–11% from its opening-day lows, outperforming the S&P 500, Nasdaq, and gold over the same period.
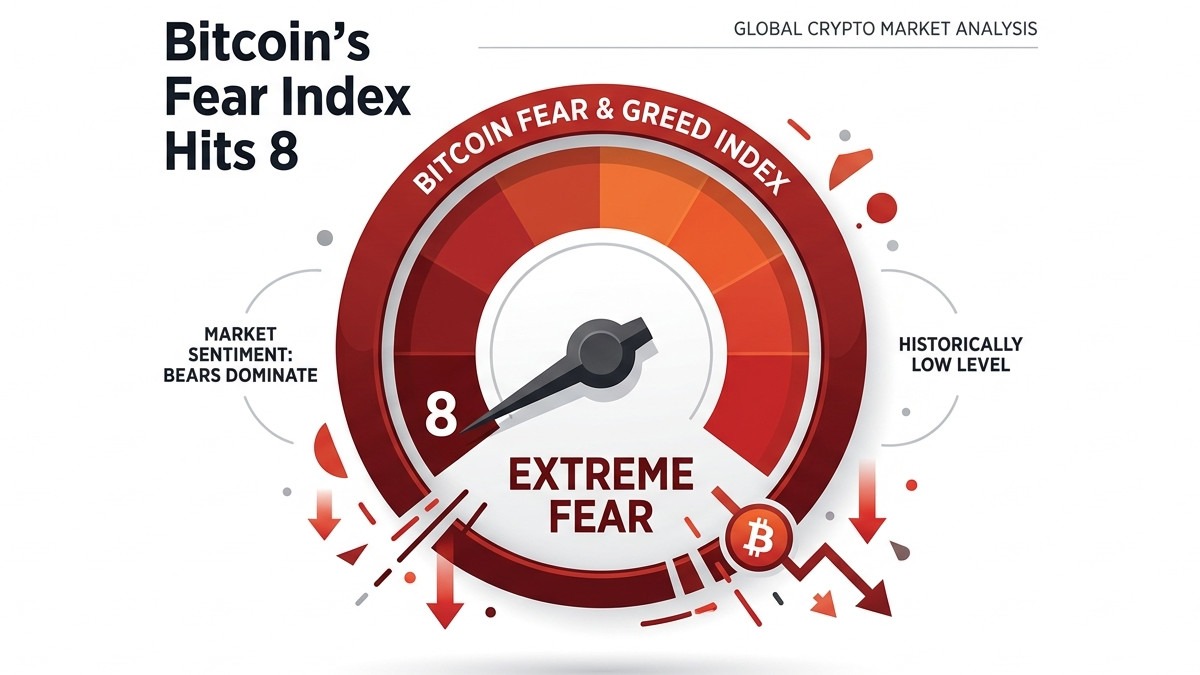
Despite the price resilience, sentiment remains deeply bearish: the crypto fear and greed index is in 'extreme fear,' funding rates for BTC perpetual futures have been negative since early March (the longest streak since April 2025), and VIX has jumped to 25.
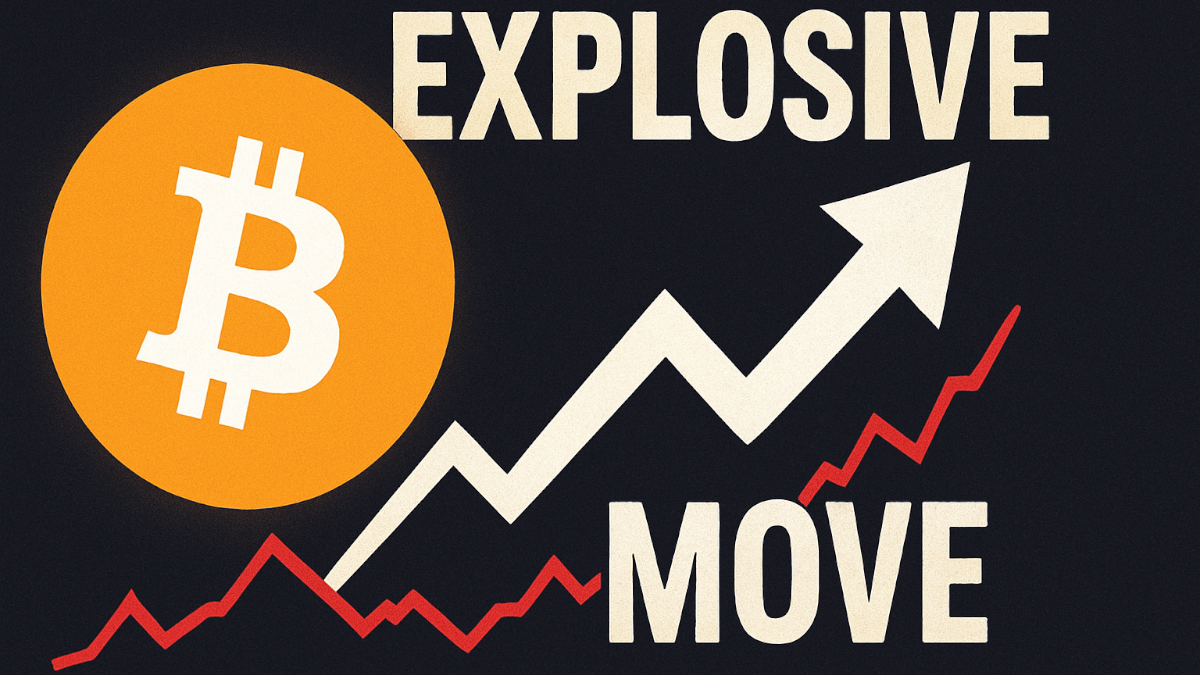
Key Risk: Bitcoin has historically dropped after 7 of 8 FOMC meetings in 2025, creating a 'sell the news' pattern. Traders are watching the March 18 FOMC dot plot
- dovish shift could push BTC above $75,000;
- dovish shift could push BTC above $75,000;
BTCUSD News
Is Bitcoin Price Recovery Real or Just a Temporary Bounce
Bitcoin dropped sharply through early 2026, falling to around $59,000, nearly half its peak price of $126,000 and now it's...
Bitcoin at $67K: Key Levels, Technicals and What's Driving the Price
Bitcoin is in a later stage of post-halving cycle, meaning prices peak and start pulling back. Big institutional buyers are...

Crypto Liquidations Domino Effect
Crypto market just went through a sharp sell-off over the weekend Bitcoin briefly fell below key support level before bouncing...

BTCUSD Analysis: Trump Walked Back Massive Tariffs on China
On Monday, Bitcoin stabilized at $115,000 after last week's sharp selloff, as Trump backed down on his threat to impose massive...
Bitcoin Eyes $145,000, But a Pullback May Come First
Bitcoin has been making strong moves again. The world’s largest cryptocurrency climbed to a six-week high of $119,500 on...

Crypto Market Hit by $1.7B in Liquidations
The cryptocurrency market just experienced one of its sharpest drops of the year, with about $1.7 billion in leveraged positions...
Explore our
Trading Conditions
- Spreads from 0.0 pip
- 30,000+ Trading Instruments
- Stop Out Level - Only 10%
Ready to Trade?
Open AccountSee Also