

- Education
- Forex Technical Analysis
- Chart Patterns
- Reversal Patterns
- Diamond
Diamond Chart Pattern - Diamond Pattern Trading
The Diamond Chart Pattern is one of the rarer reversal formations traders encounter, often appearing right before a major trend change takes hold. Shaped like a widening-then-narrowing diamond, it signals shifting control between buyers and sellers. This guide breaks down how to spot it, trade it, and read it with confidence.
Key Moments
- The diamond pattern forms from two merged triangles, one widening and one narrowing, creating a distinctive rhombus shape on the chart.
- It appears most often at market tops or bottoms, making it a reliable warning sign of an approaching trend reversal.
- Trading volume typically declines during the widening phase and picks back up as the pattern narrows toward its breakout point.
- A confirmed breakout below the lower diamond boundary suggests a bearish move, while a breakout above suggests a bullish continuation reversal.
- Traders commonly measure the pattern's height to project a realistic target price once the breakout direction is confirmed.
What is a Diamond Chart Pattern
A Diamond Chart Pattern is a technical formation that marks a potential reversal after price has moved strongly in one direction. It gets its name from the shape it draws on a chart, formed by two trend lines that widen and then converge again. This visual signature makes it relatively easy to spot once traders know what to look for.
The pattern unfolds in two distinct phases that together create its recognizable rhombus outline. First, price swings become increasingly wide and volatile, pushing the upper and lower boundaries further apart. Then, in the second phase, those same swings begin to contract, pulling the boundaries back together toward a single point.
Diamond patterns are considered rare compared to formations like triangles, flags, or head and shoulders setups. Their scarcity makes them a notable signal when they do appear on a price chart. Many traders treat a confirmed diamond as strong evidence that the prevailing trend is losing momentum.
This pattern can appear as either a diamond top, forming after an uptrend, or a diamond bottom, forming after a downtrend. Both variations follow the same widening-then-narrowing structure but differ in where they occur on the chart. Understanding this context is the first step before attempting to trade the pattern itself.
How to Trade Diamond Chart Pattern
Trading a Diamond Chart Pattern successfully depends on patience, since the formation can take time to fully develop before a breakout occurs. The steps below outline a practical approach, from identifying the shape to managing an open position once the market moves.
1. Identify the pattern boundaries
Look for a widening range of price swings followed by a narrowing range, forming the two halves of the diamond shape. Draw trend lines connecting the swing highs and swing lows to confirm the boundaries visually.
2. Confirm volume and trend context
Check that volume declines during the widening phase and rises again as the pattern narrows, which supports the pattern's validity. Also confirm the diamond appears after a clear prior trend, since context strengthens the reversal signal.
3. Open a trading account
Before placing any trade, open trading account with a regulated broker that offers the instruments you plan to trade. This gives access to live charting tools needed to track the pattern in real time.
4. Choose your trading platform
Select a platform suited to your analysis style, such as MetaTrader 4 for straightforward charting, MetaTrader 5 for more advanced multi-asset analysis, or NetTradeX for its built-in pattern recognition features.
5. Set entry, stop-loss and take-profit levels
Enter a trade once price breaks decisively through the upper or lower diamond boundary with supporting volume. Place a stop-loss just beyond the opposite boundary and set a take-profit based on the pattern's measured height.
6. Monitor and manage the trade
Track the trade as it develops and be ready to adjust your stop-loss to lock in gains if price moves favorably. Watch for any signs of a false breakout, which can occur if volume fails to confirm the move.
Diamond Chart Pattern Trading
Diamond Chart Pattern trading works best when combined with confirmation from other technical signals rather than relied on in isolation. Traders often pair the pattern with volume analysis, momentum indicators, or support and resistance levels for added confidence. This layered approach helps filter out weaker or premature breakout signals.
Because diamond patterns are relatively uncommon, traders who spot one often treat it as a higher-conviction setup compared to more frequent formations. The rarity itself becomes part of the appeal, since fewer false signals tend to occur with less common patterns. Still, no pattern guarantees a specific outcome, so risk management remains essential.
Position sizing and stop-loss placement matter just as much as correctly identifying the pattern itself. A trader who enters too early, before the breakout is confirmed, risks getting caught in a false move. Waiting for a decisive close beyond the diamond's boundary reduces this risk considerably.
Diamond patterns can appear across various markets, including forex, stocks, and commodities, wherever price action produces the characteristic widening-then-narrowing structure. This versatility means the trading principles discussed here apply broadly, regardless of the specific instrument being analyzed.
Diamond Chart Pattern Formation
Diamond Chart pattern is characterized by four limited trend lines representing two support lines below and two resistance levels above which respectively connect the most recent lows and highs, visually forming a figure shaped as a brilliant or a rhomb as price fluctuations amplitude initially widens and then narrows.
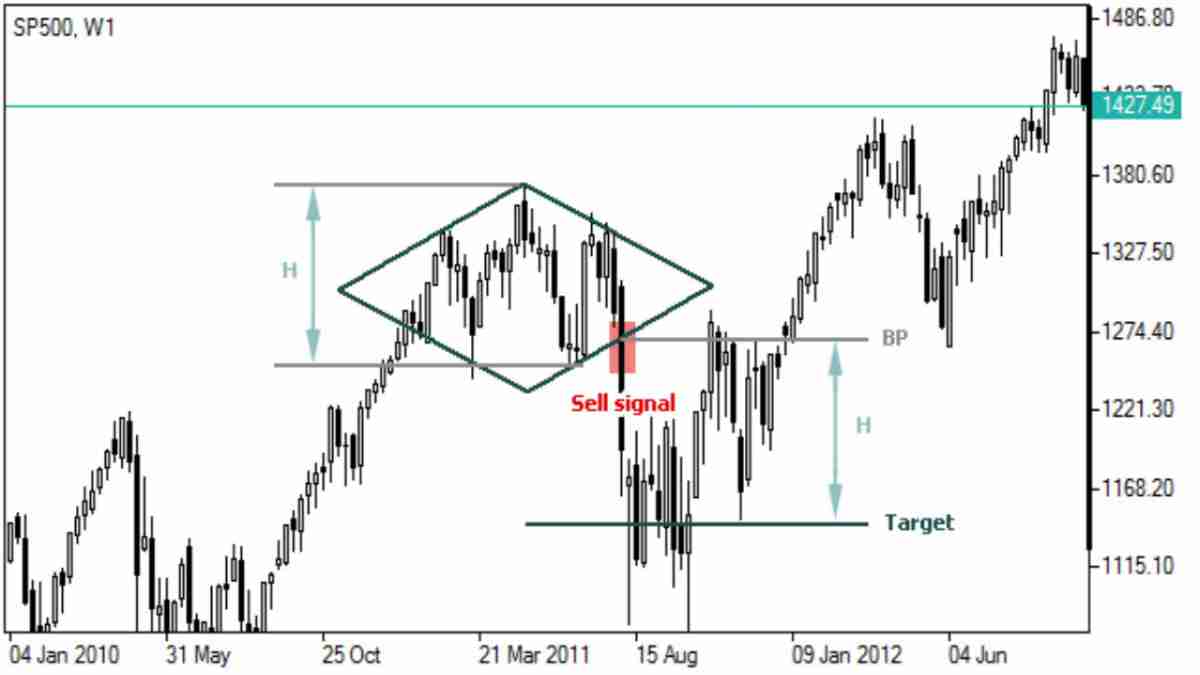
Interpretation of Diamond Chart Pattern
As soon as a support line at the right is violated (plus a certain deviation is possible), it can be interpreted as change in direction of the trend downwards and serves as a sell signal.
Diamond Chart Pattern Target Price
Following brilliant pattern formation the price is generally believed to fall at least to its target level, calculated as follows:
T = BP – H, Where:T – target level;
BP – right support breakthrough point;
H – pattern’s height (distance between pattern’s bottom and top).
Conclusion
The Diamond Chart Pattern offers traders a distinctive way to anticipate reversals after strong price trends run their course. Its widening-then-narrowing structure, though rare, provides a visually clear signal once traders learn to recognize its two-phase formation. Pairing it with volume confirmation makes the pattern considerably more reliable.
Successful trading of this pattern comes down to patience during formation and discipline during execution. Waiting for a confirmed breakout, setting sensible stop-loss levels, and measuring the pattern's height for target projections all contribute to a more structured approach. These habits apply whether trading a diamond top or a diamond bottom.
As with any chart pattern, the diamond formation works best as one part of a broader technical analysis toolkit rather than a standalone signal. Combining it with trend context, volume, and other indicators gives traders a fuller picture before committing capital to a trade.
Forex Indicators FAQ
What is a Forex Indicator?
Forex technical analysis indicators are regularly used by traders to predict price movements in the Foreign Exchange market and thus increase the likelihood of making money in the Forex market. Forex indicators actually take into account the price and volume of a particular trading instrument for further market forecasting.
What are the Best Technical Indicators?
Technical analysis, which is often included in various trading strategies, cannot be considered separately from technical indicators. Some indicators are rarely used, while others are almost irreplaceable for many traders. We highlighted 5 the most popular technical analysis indicators: Moving average (MA), Exponential moving average (EMA), Stochastic oscillator, Bollinger bands, Moving average convergence divergence (MACD).
How to Use Technical Indicators?
Trading strategies usually require multiple technical analysis indicators to increase forecast accuracy. Lagging technical indicators show past trends, while leading indicators predict upcoming moves. When selecting trading indicators, also consider different types of charting tools, such as volume, momentum, volatility and trend indicators.
Do Indicators Work in Forex?
There are 2 types of indicators: lagging and leading. Lagging indicators base on past movements and market reversals, and are more effective when markets are trending strongly. Leading indicators try to predict the price moves and reversals in the future, they are used commonly in range trading, and since they produce many false signals, they are not suitable for trend trading.

Not sure about your Forex skills level?
Take a Test and We Will Help You With The Rest
You can see the graphical object on the price chart by downloading one of the trading terminals offered by IFC Markets.



Was this article helpful?

 You can study CFD trading more thoroughly and see CFD trading examples in the section How To Trade CFDs Visit Educational Center