- Analytics
- Technical Analysis
Apple Technical Analysis - Apple Trading: 2019-06-12
Accelerating services revenue growth bullish for Apple
Apple counts on services revenue growth to become another major driver of growth. Will the Apple stock price continue rebounding?
Apple reported second quarter revenue of $58 billion, down 5% from the same quarter a year ago, over a month ago. And while iPhone revenue came in at $31.05 billion, also down but making up over 53% of Apple’s entire revenue, services division hit an all-time high of $11.5 billion in revenue. A month before the report, the company announced several new software initiatives including News Plus, Apple Arcade, and Apple TV Plus. The Apple Arcade and Apple TV Plus services are expected to launch this fall, and Apple counts on continuing double-digit growth of services revenue to drive overall revenue growth as revenue and units sold of Apple’s flagship product iPhone are under strain because of US-China trade dispute.
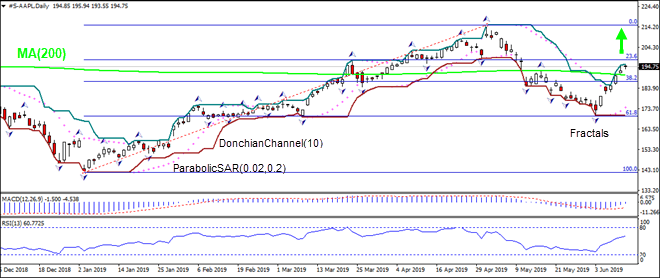
On the daily timeframe the S-AAPL: D1 has closed above the 200-day moving average MA(200) and Fibonacci 38.2. This is bullish.
- The Parabolic indicator gives a buy signal.
- The Donchian channel indicates uptrend: it has widened up.
- The MACD indicator gives a bullish signal: it is below the signal line and the gap is narrowing.
- The RSI oscillator is rising but has not reached the overbought zone yet.
We believe the bullish momentum will continue after the price breaches above the upper boundary of Donchian channel at 195.94. This level can be used as an entry point for placing a pending order to buy. The stop loss can be placed below the fractal low at 170.38. After placing the order, the stop loss is to be moved every day to the next fractal low, following Parabolic signals. Thus, we are changing the expected profit/loss ratio to the breakeven point. If the price meets the stop loss level (170.38) without reaching the order (195.94), we recommend cancelling the order: the market has undergone internal changes which were not taken into account.
Technical Analysis Summary
| Position | Buy |
| Buy stop | Above 195.94 |
| Stop loss | Below 170.38 |
Explore our
Trading Conditions
- Spreads from 0.0 pip
- 30,000+ Trading Instruments
- Stop Out Level - Only 10%
Ready to Trade?
Open Account Note:
This overview has an informative and tutorial character and is published for free. All the data, included in the overview, are received from public sources, recognized as more or less reliable. Moreover, there is no guarantee that the indicated information is full and precise. Overviews are not updated. The whole information in each overview, including opinion, indicators, charts and anything else, is provided only for familiarization purposes and is not financial advice or а recommendation. The whole text and its any part, as well as the charts cannot be considered as an offer to make a deal with any asset. IFC Markets and its employees under any circumstances are not liable for any action taken by someone else during or after reading the overview.
