- Analytics
- Technical Analysis
Australian Stock Index Technical Analysis - Australian Stock Index Trading: 2019-10-11
Technical setup bullish for AU200
Australia’s trade surplus declined as did business and consumer sentiment. Will the AU200 stock index continue advancing?
Recent economic data from Australia were mixed: Australia's retail sales rose in August but trade surplus declined while private sector activities expanded in September after a contraction in August. Retail sales rose by 0.4% in August after stagnant sales in July, driven by stronger spending in restaurants and on household goods. Australia's trade surplus declined to A$5.926 billion following A$7.253 billion surplus in July, as exports fell by 3%, while imports declined by 0.4%. Markit reported the Commonwealth Bank Composite PMI increased to 52.0 in September from 49.3 in the previous month. And NAB business confidence index declined in September with Westpac Bank Consumer Sentiment Index falling from 98.2 in September to 92.8 in October, its lowest level since July 2015. However the AU200 is entering an uptrend phase on daily tirmeframe chart.
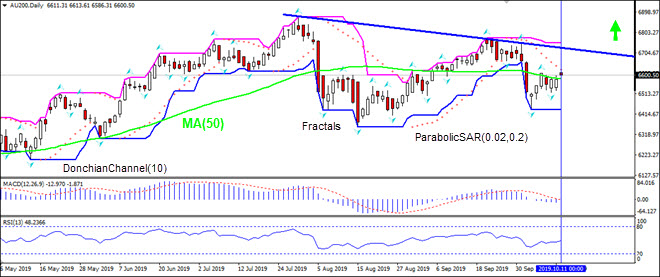
On the daily timeframe AU200: D1 is retracing after breaching above 50-day moving average MA(50).
- The Donchian channel indicates no trend: it is flat.
- The Parabolic indicator has formed a sell signal.
- The MACD indicator is below the signal line and the gap is narrowing, which is a bullish signal.
- The RSI oscillator is rising and has not reached the overbought zone.
We believe the bullish momentum will continue after the price closes above the upper boundary of Donchian channel at 6608.45. This level can be used as an entry point for placing a pending order to buy. The stop loss can be placed below the fractal low at 6519.31. After placing the order, the stop loss is to be moved every day to the next fractal low, following Parabolic signals. Thus, we are changing the expected profit/loss ratio to the breakeven point. If the price meets the stop loss level (6519.31) without reaching the order (6608.45), we recommend cancelling the order: the market has undergone internal changes which were not taken into account.
Technical Analysis Summary
| Position | Buy |
| Buy stop | Above 6608.45 |
| Stop loss | Below 6519.31 |
Explore our
Trading Conditions
- Spreads from 0.0 pip
- 30,000+ Trading Instruments
- Stop Out Level - Only 10%
Ready to Trade?
Open Account Note:
This overview has an informative and tutorial character and is published for free. All the data, included in the overview, are received from public sources, recognized as more or less reliable. Moreover, there is no guarantee that the indicated information is full and precise. Overviews are not updated. The whole information in each overview, including opinion, indicators, charts and anything else, is provided only for familiarization purposes and is not financial advice or а recommendation. The whole text and its any part, as well as the charts cannot be considered as an offer to make a deal with any asset. IFC Markets and its employees under any circumstances are not liable for any action taken by someone else during or after reading the overview.
