- Analytics
- Technical Analysis
AUD/USD Technical Analysis - AUD/USD Trading: 2017-09-28
Weak economic data bearish for Australian dollar
Australian economic data were weak recenttly. Will the AUDUSD continue weakening?
The Reserve Bank of Australia held the interest rate at 1.5% for the twelfth month at its September 5 policy meeting. The central bank mentioned appreciating Australian dollar would be expected to result in a slower pick-up in economic activity, and low level of interest rates is continuing to support the Australian economy as RBA held the stance of monetary policy unchanged. Recent data were weak after economic growth accelerated to 0.8% over quarter in Q2 following 0.3% in Q1. Balance of trade surplus declined to 460 million Australian dollars from 890 million in June as exports fell month-on-month twice as fast as imports. Retail sales were stagnant in July while June’s reading was to 0.2%. Unemployment remained at 5.6% in August.
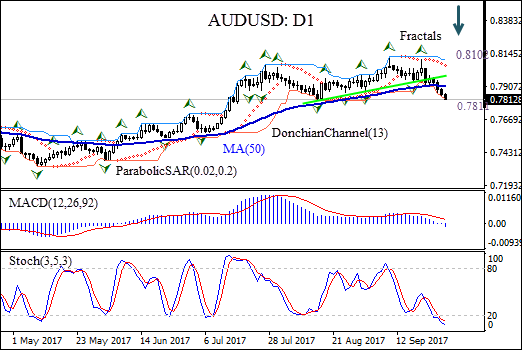
On the daily timeframe AUDUSD: D1 is retracing lower after hitting sixteen-month high in the beginning of September. The price has fallen below the 50-day moving average MA(50) and the support line.
- The Donchian channel indicates downtrend: it is tilted down.
- The Parabolic indicator gives a sell signal.
- The MACD indicator is below the signal line and the gap is widening, which is a bearish signal.
- The stochastic oscillator has breached into oversold zone which is a bullish signal.
We believe the bearish momentum will continue after the price closes below the lower boundary of Donchian channel at 0.7811. This level can be used as an entry point for placing a pending order to sell. The stop loss can be placed above the fractal high at 0.8102. After placing the order, the stop loss is to be moved every day to the next fractal high, following Parabolic signals. Thus, we are changing the probable profit/loss ratio to the breakeven point. If the price meets the stop loss level (0.8102) without reaching the order (0.7811), we recommend cancelling the position: the market has undergone internal changes which were not taken into account.
Technical Analysis Summary
| Position | Sell |
| Sell stop | Below 0.7811 |
| Stop loss | Above 0.8102 |
Explore our
Trading Conditions
- Spreads from 0.0 pip
- 30,000+ Trading Instruments
- Stop Out Level - Only 10%
Ready to Trade?
Open Account Note:
This overview has an informative and tutorial character and is published for free. All the data, included in the overview, are received from public sources, recognized as more or less reliable. Moreover, there is no guarantee that the indicated information is full and precise. Overviews are not updated. The whole information in each overview, including opinion, indicators, charts and anything else, is provided only for familiarization purposes and is not financial advice or а recommendation. The whole text and its any part, as well as the charts cannot be considered as an offer to make a deal with any asset. IFC Markets and its employees under any circumstances are not liable for any action taken by someone else during or after reading the overview.
