- Analytics
- Technical Analysis
EU 50 Index Technical Analysis - EU 50 Index Trading: 2017-10-23
Preparing for the ECB meeting
The European Central Bank may announce about tapering of its monetary stimulus program for the EU economy at its next meeting on October 26, 2017. Will the EU50 prices fall?
The European economy shows growth for the 5th consecutive year. Most market participants expect that on Thursday ECB President Mario Draghi will announce a reduction in the volume of buyback of bonds from the current level of 60 billion euros to 40 billion euros per month. Changes may take effect from the beginning of the next year. At the same time, the ECB interest rate is not expected to rise, which is now 0%. The buyback program of bonds may last for 6 or 9 months of 2018. Note that the next meeting of the ECB will be held only on January 25, 2018, so the likelihood of any of its statements at the meeting on Thursday is quite high. Another factor for the possible correction of the Pan-European stock index is a relatively weak forecast of the aggregate profit of the largest EU companies. According to the results of the 3rd quarter of 2017, it is expected to grow by 4.5% compared to the same period of 2016, and excluding energy companies - only by 1.3%. Meanwhile, from the beginning of October 2016 to the beginning of October 2017, the EU50 grew by 20%.
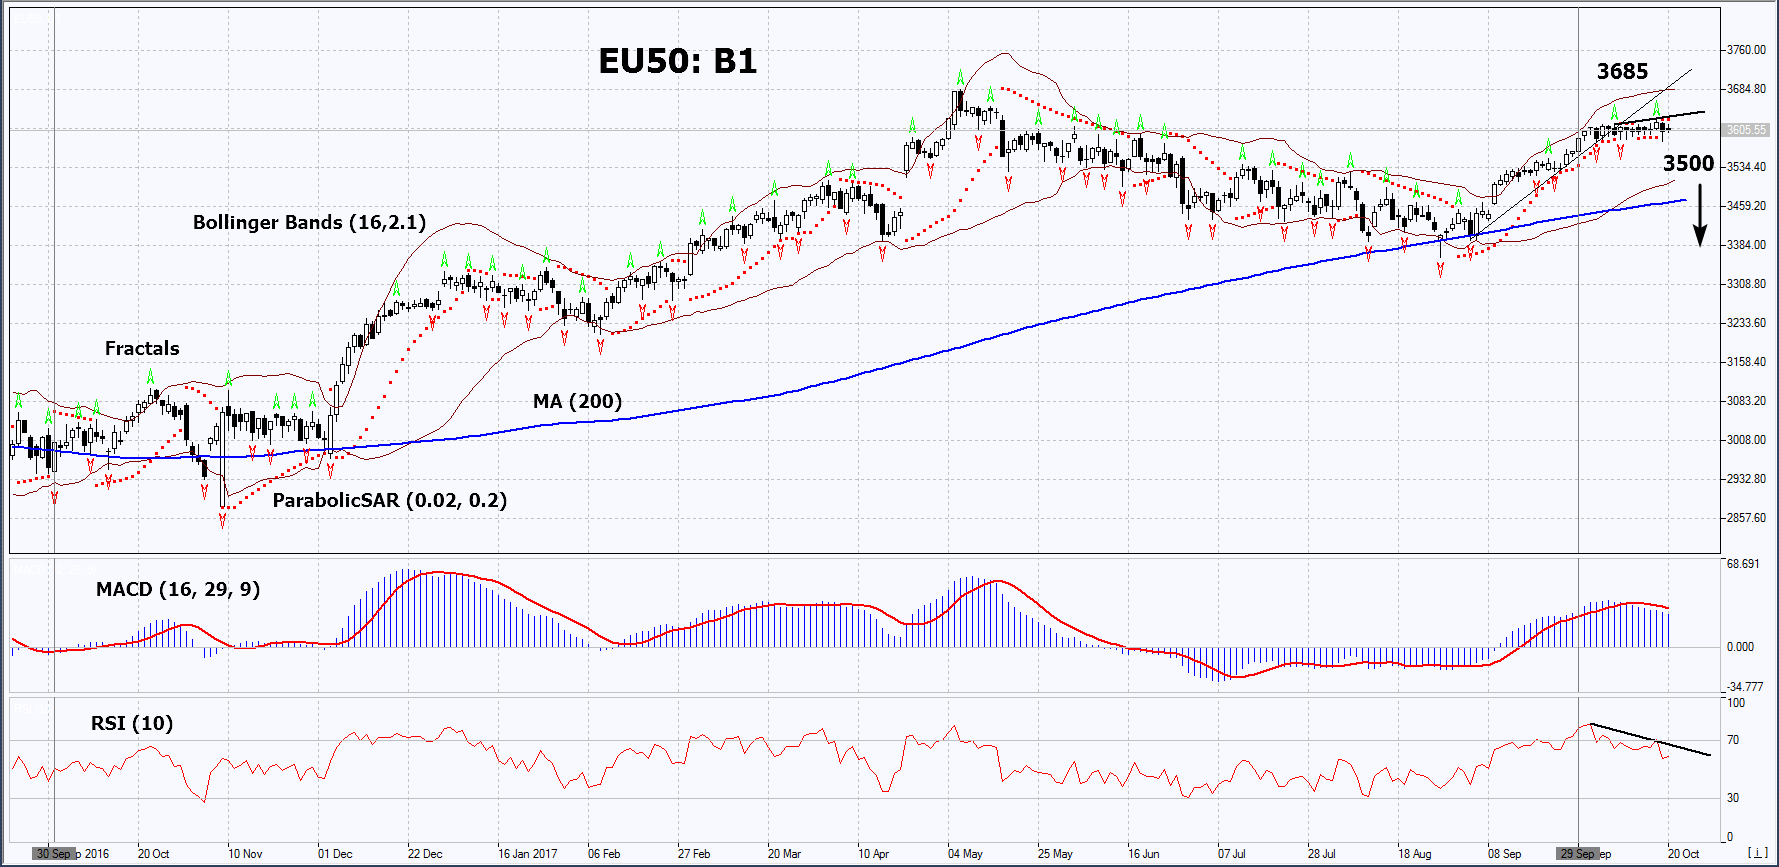
On the daily timeframe, EU50: D1 is in a neutral trend. A full-fledged downward correction is possible in case of a reduction in the quarterly aggregate profit of European companies, as well as in case of tapering ECB programs to stimulate the EU economy.
- The Parabolic indicator gives a bearish signal.
- The Bollinger bands have widened, which indicates high volatility.
- The RSI indicator is above 50. It has formed a negative divergence.
- The MACD indicator gives a bearish signal.
The bearish momentum may develop in case EU50 falls below the 4 fractal lows and the lower Bollinger band at 3500. This level may serve as an entry point. The initial stop loss may be placed above the two-year high, the upper Bollinger band and the Parabolic signal at 3685. After opening the pending order, we shall move the stop to the next fractal high following the Bollinger and Parabolic signals.Thus, we are changing the potential profit/loss to the breakeven point. More risk-averse traders may switch to the 4-hour chart after the trade and place there a stop loss moving it in the direction of the trade. If the price meets the stop level at 3685 without reaching the order at 3500, we recommend cancelling the position: the market sustains internal changes that were not taken into account.
Summary of technical analysis
| Position | Sell |
| Sell stop | Below 3500 |
| Stop loss | Above 3685 |
Explore our
Trading Conditions
- Spreads from 0.0 pip
- 30,000+ Trading Instruments
- Stop Out Level - Only 10%
Ready to Trade?
Open Account Note:
This overview has an informative and tutorial character and is published for free. All the data, included in the overview, are received from public sources, recognized as more or less reliable. Moreover, there is no guarantee that the indicated information is full and precise. Overviews are not updated. The whole information in each overview, including opinion, indicators, charts and anything else, is provided only for familiarization purposes and is not financial advice or а recommendation. The whole text and its any part, as well as the charts cannot be considered as an offer to make a deal with any asset. IFC Markets and its employees under any circumstances are not liable for any action taken by someone else during or after reading the overview.
