- Analytics
- Technical Analysis
EUR/USD Technical Analysis - EUR/USD Trading: 2017-08-17
Weak economic reports are bearish for euro
Expected fall in eurozone inflation is bearish for euro. Will the euro continue the decline against the greenback?
Recent data from eurozone were weaker than expected, weighing on euro. European Union statistics agency reported on Monday industrial production in the eurozone fell 0.6% in June compared with May, indicating that the region’s economy may be slowing down. And German statistics office Destatis reported the next day Germany’s economy unexpectedly slowed in the second quarter: the GDP expanded 0.6% compared with 0.7% in the first quarter. Weak inflation data are expected to come out today at 11:00 CET: while headline inflation is expected to remain unchanged below ECB’s 2% target rate at 1.3%, consumer prices are expected to decline in July 0.5% compared with the June price index. Today the minutes of the European Central Bank July 20 meeting will be published also after the ECB left its policy unchanged and ECB’s President Mario Draghi emphasized easy monetary policy was still needed as inflation is not where it should be. No surprises are expected. And the news on Wednesday Draghi would not use his Jackson Hole appearance to signal ECB policy change further weighed on euro.
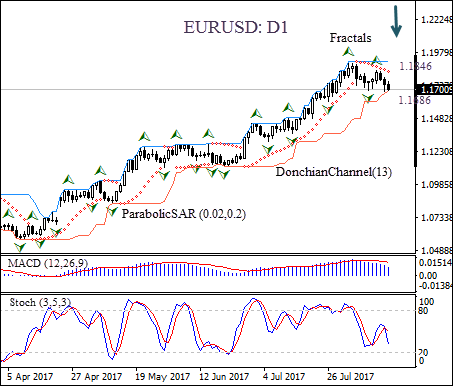
On the daily timeframe EUR/USD has been trading with negative bias after hitting 32-month high two weeks ago.
- The Donchian channel is flat, indicating no trend yet.
- The MACD indicator is above the signal line and the gap is narrowing, which is a bearish signal.
- The Parabolic indicator gives a sell signal.
- The stochastic oscillator is declining though it has not crossed into the oversold zone.
We believe the bearish momentum will continue after the price closes below the lower Donchian boundary at 1.1686, It can be used as an entry point for a pending order to sell. The stop loss can be placed above the last fractal high at 1.1846. After placing the pending order the stop loss is to be moved every day to the next fractal high, following Parabolic signals. Thus, we are changing the probable profit/loss ratio to the breakeven point. If the price meets the stop-loss level (1.1846) without reaching the order (1.1686) we recommend cancelling the position: the market sustains internal changes which were not taken into account.
Technical Analysis Summary
| Position | Sell |
| Sell stop | Below 1.1686 |
| Stop loss | Above 1.1846 |
Explore our
Trading Conditions
- Spreads from 0.0 pip
- 30,000+ Trading Instruments
- Stop Out Level - Only 10%
Ready to Trade?
Open Account Note:
This overview has an informative and tutorial character and is published for free. All the data, included in the overview, are received from public sources, recognized as more or less reliable. Moreover, there is no guarantee that the indicated information is full and precise. Overviews are not updated. The whole information in each overview, including opinion, indicators, charts and anything else, is provided only for familiarization purposes and is not financial advice or а recommendation. The whole text and its any part, as well as the charts cannot be considered as an offer to make a deal with any asset. IFC Markets and its employees under any circumstances are not liable for any action taken by someone else during or after reading the overview.
